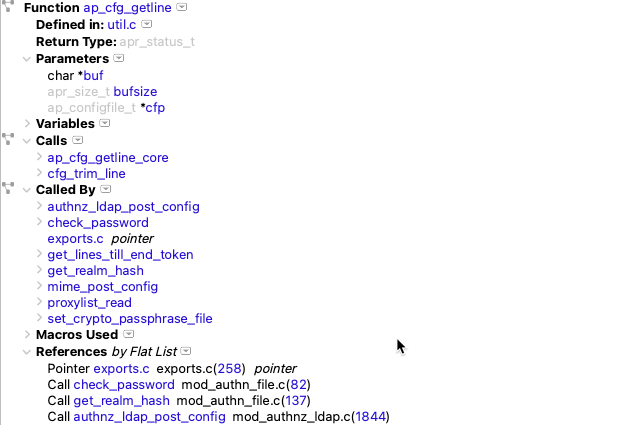
Abstract: This article generates code coverage information for openssl and shows a few ways to use the information.
I have to admit that the only time I’ve used code coverage is for unit tests in school. At the time, I only cared that the final coverage percentage of my unit tests met the required value. But suppose I wanted to use code coverage for more than just checking off a requirement. What can I do with it?
Generating Code Coverage Data
First, I’ll need to generate some code coverage information. I’m going to use openssl since it already has unit tests. The first step is to compile the project with flags to track coverage.
git clone https://github.com/openssl/openssl.git
cd openssl
export CC="gcc -fprofile-arcs -ftest-coverage"
./Configure
make > build.log
Finally, I need to run the unit tests, which will store coverage information in .gcda and .gcno files throughout the project. I’ll run the openssl tests with:
make testsBuilding a Web Code Coverage Report
The .gcda and .gcno files are binary. So, the next step is to generate human readable reports with lcov. I had to download lcov from here. The lcov tool scans for the raw code coverage files and creates an information file. The scan command is:
lcov --capture --directory . --output-file coverage.infoThe coverage.info file is a text file, so it’s actually readable. But I prefer the web view, generated with the genhtml command installed with lcov:
mkdir lcov-out
genhtml coverage.info --output-directory lcov-out
Then I can open lcov-out/index.html in a web browser:
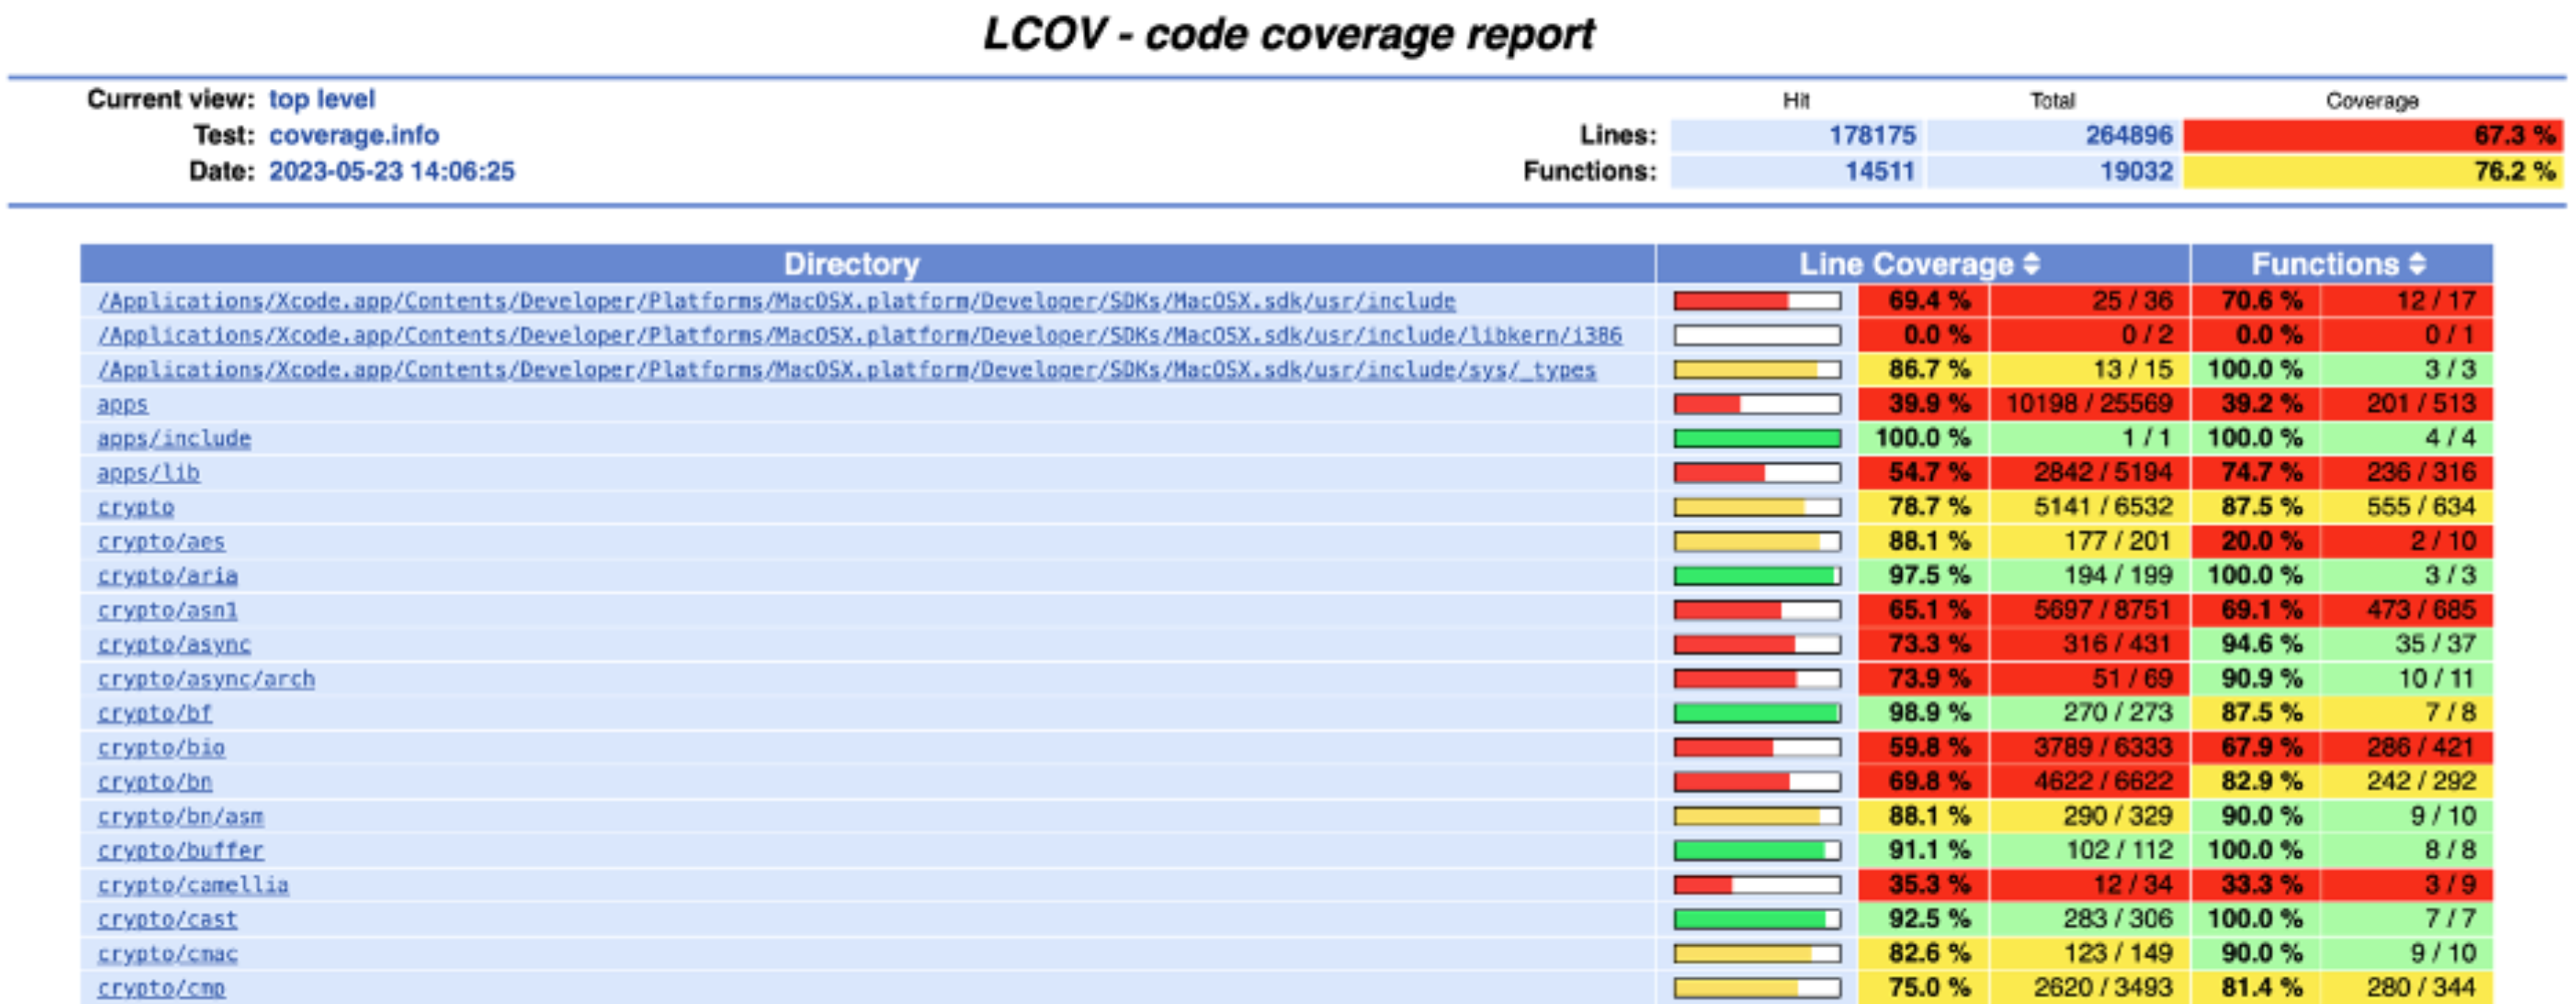
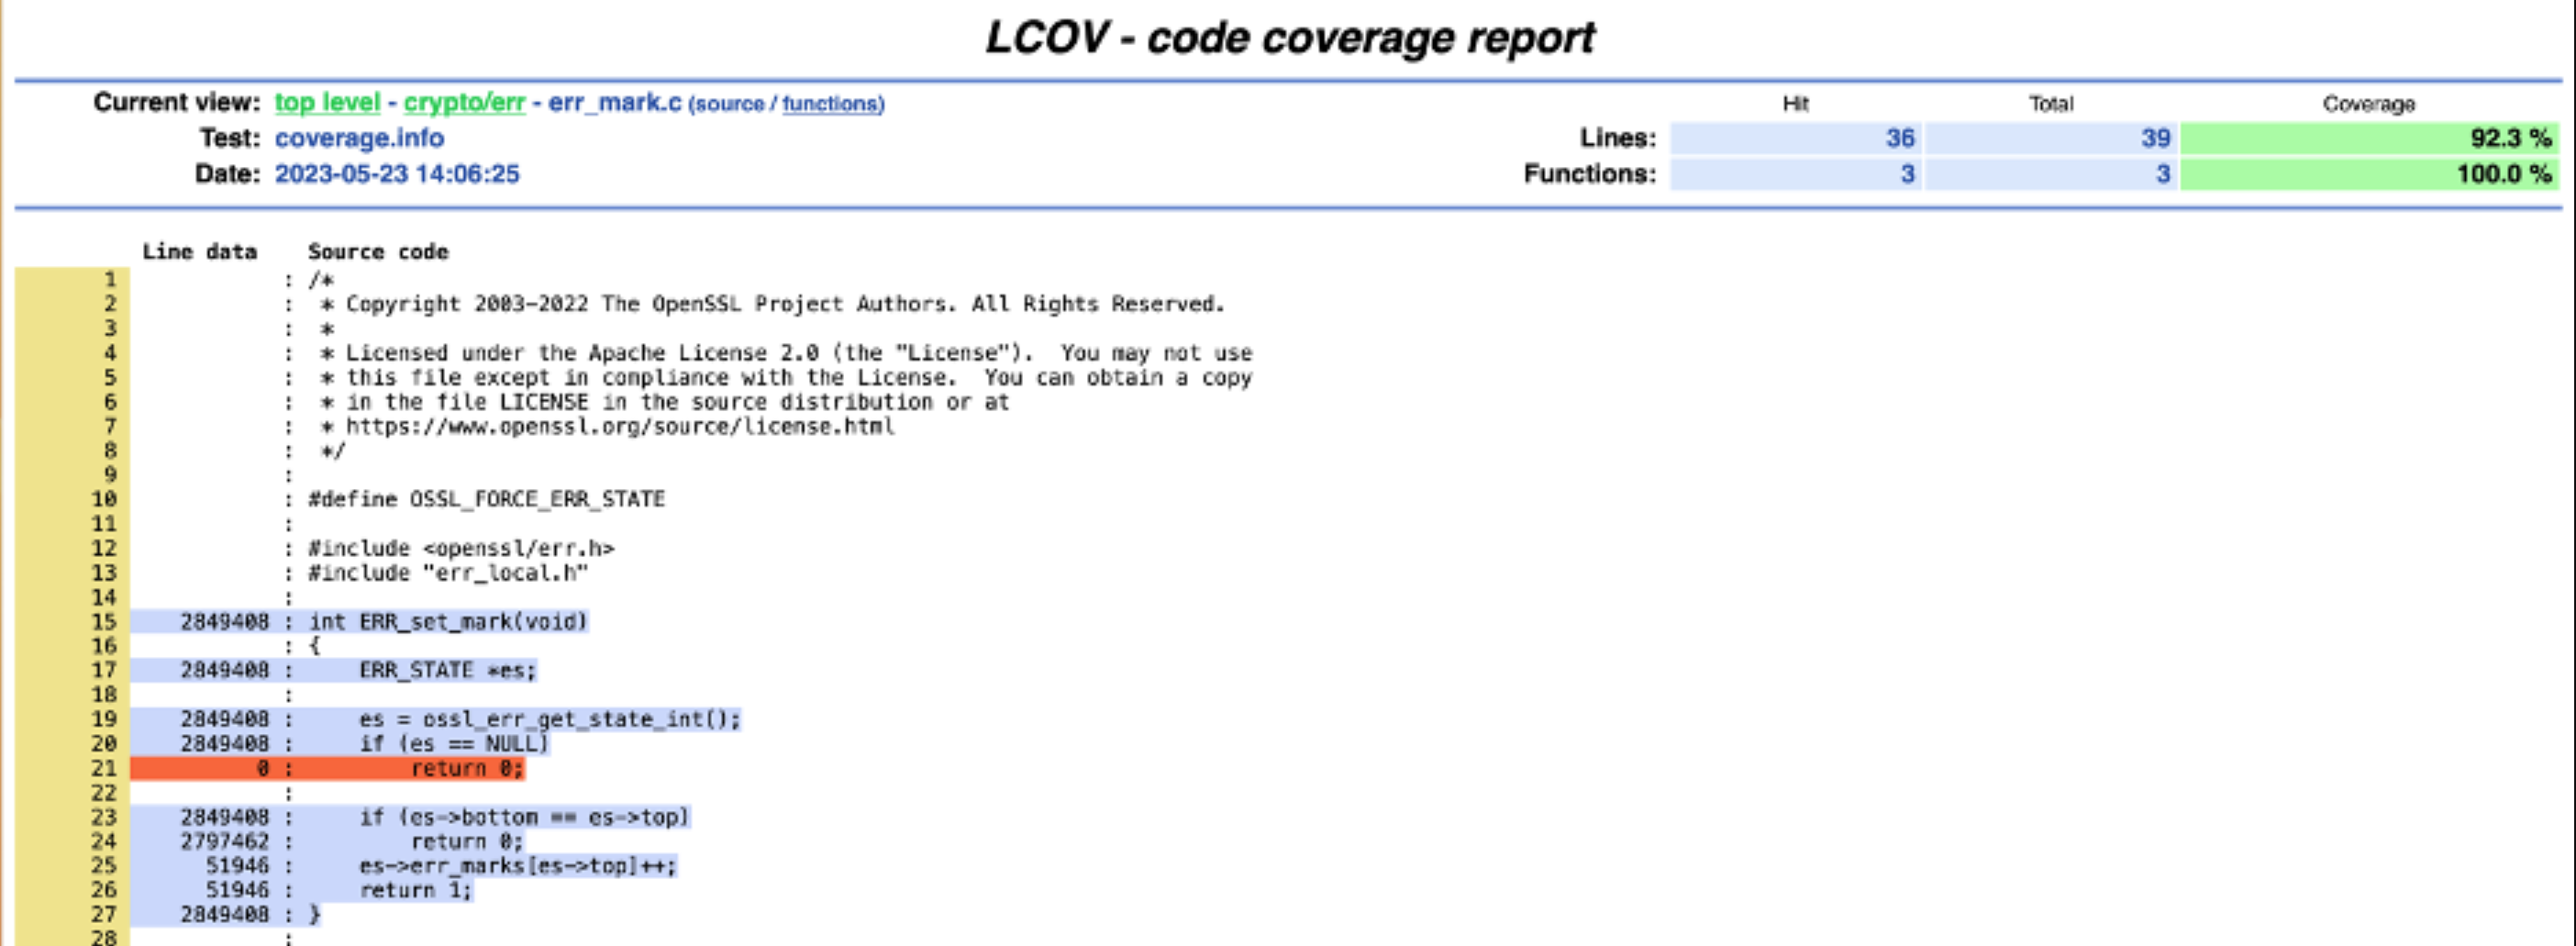
The initial view gives me summary information by directory. I can also navigate to particular files to view the code coverage for each line:
Tracking Code Coverage Over a Call Tree
If I’m interested in making sure a particular function is covered, the web view is sufficient. I can quickly see which lines and paths aren’t covered, like the null error state path in the screenshot. But how else could I use this information? Well, let’s suppose I want to check that all the functions that call my function of interest are also covered. Then, I want to combine code coverage information with a call tree.
Understand can generate called and called by trees. To make an Understand project for openssl, I’ll use the build log that I saved earlier and the command line tool und:
und create -db openssl.und -languages c++ add -cc gcc build.log analyzeNow, I can open the Understand project in the Understand GUI and select my function of interest. I’ll arbitrarily pick the _CONF_get_number as the first function alphabetically with at least one coverage hit and more than one calling function. The initial called by graph is:

I can find the coverage information for each function in the graph from my lcov web report, but that would be tedious. It’s faster to teach Understand how to find coverage values for functions. I’ll install the coverage.upy Understand plugin by dragging it onto the Understand GUI. The plugin reads coverage information from a file named coverage.info in the root of my project. Now, I can use the instructions here to add a metric color scale to my graph.
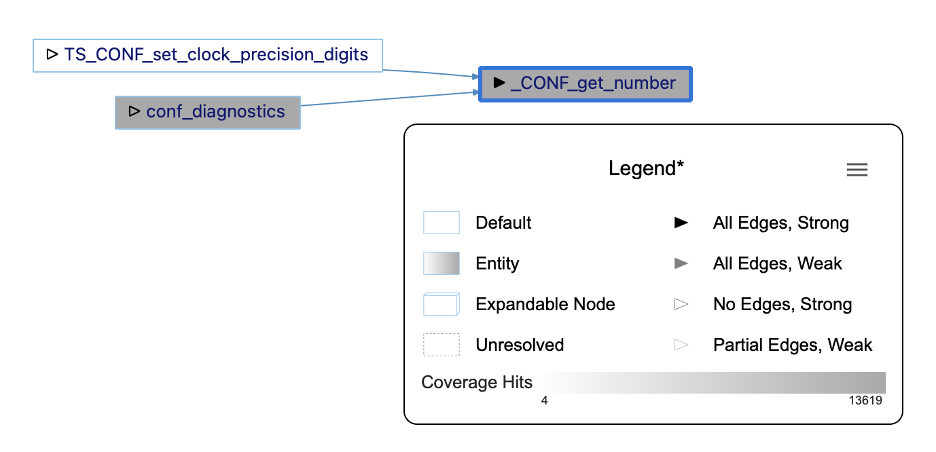
It looks like nearly all the coverage hits for my function come through the conf_diagnostics path and not from TS_CONF_set_clock_precision_digits.
Compare Code Coverage to Complexity with TreeMaps
In addition to call trees, maybe I’d like a graphical overview of my whole project. Something similar to the lcov report, but as a treemap. Understand can generate treemaps with any of the metrics it supports, which includes the code coverage metrics I’ve installed. So, I’ll make my treemap size by the sum of the McCabe Cyclomatic Complexity for the functions in the file and the color by the percentage of lines covered by the tests in the file.
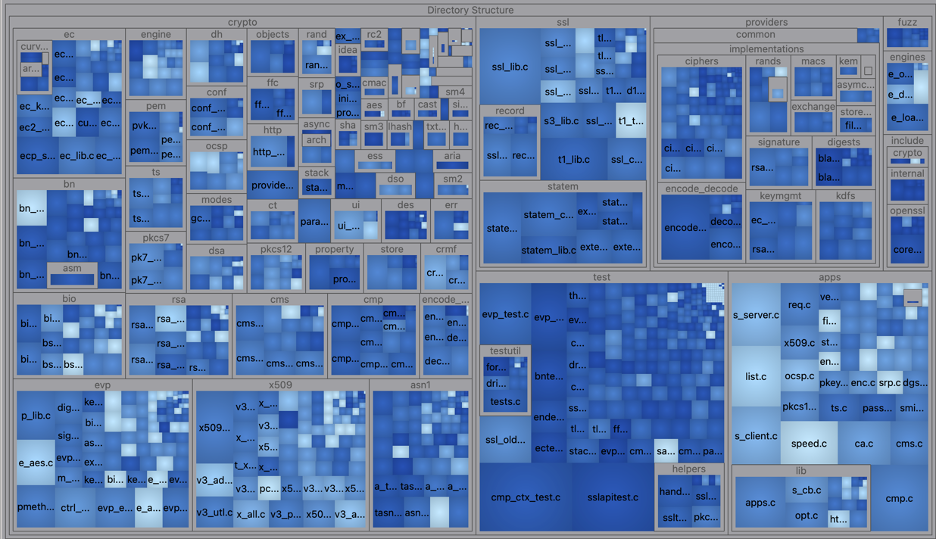
In treemaps, I usually look for outliers. So, I’m looking for big squares with light colors because that means complex files with not very much test coverage. So, for instance, I might worry about e_aes.c which is relatively complex (Sum of McCabe Cyclomatic Complexity = 389) and has less test coverage than the other files in the crypto/evp library (14% line coverage).
Calculate Coverage for Custom Groups
What else might be fun? The lcov report groups files by directory. But maybe for my source code, I want to group things by author so I know which engineers need to work on their unit tests. Groups in Understand are called architectures, and Understand automatically creates a Directory Structure architecture, as used by the metric treemap.
I can create an architecture by hand, or I can teach Understand how to build my architecture through a plugin. I’ll install the git author plugin to create an architecture by the last person who committed to a file. Then, I enable the architecture for my project from the Architecture Browser.
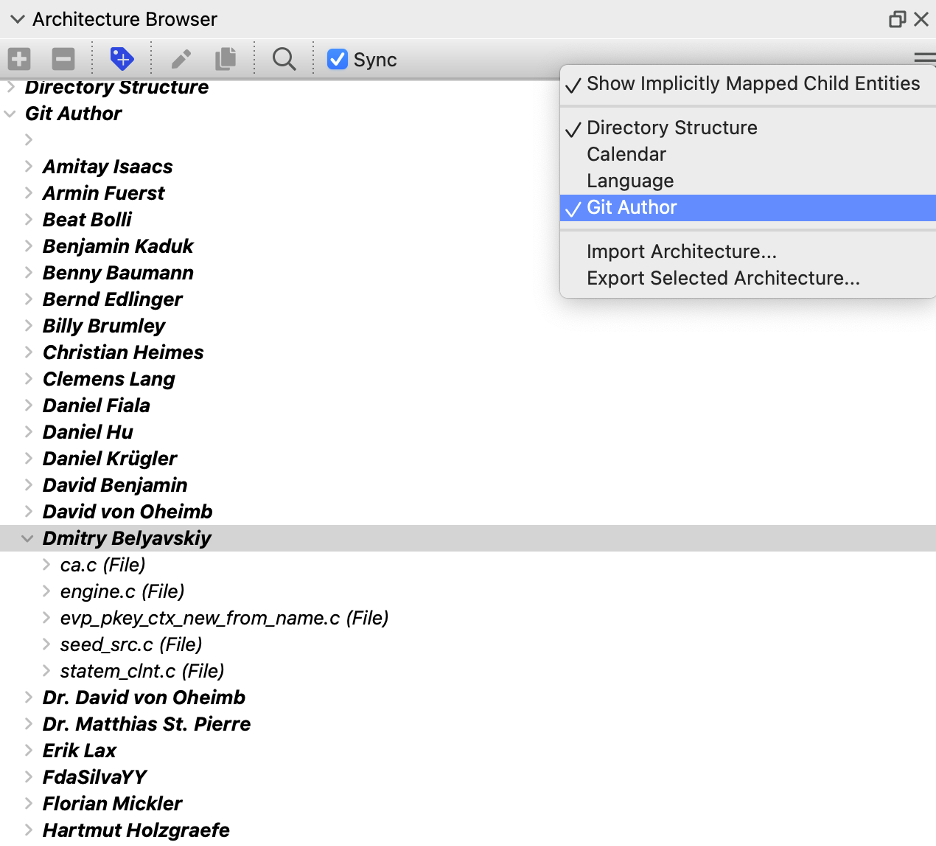
Now, I can browse metrics for my selected architecture to see the coverage summary:
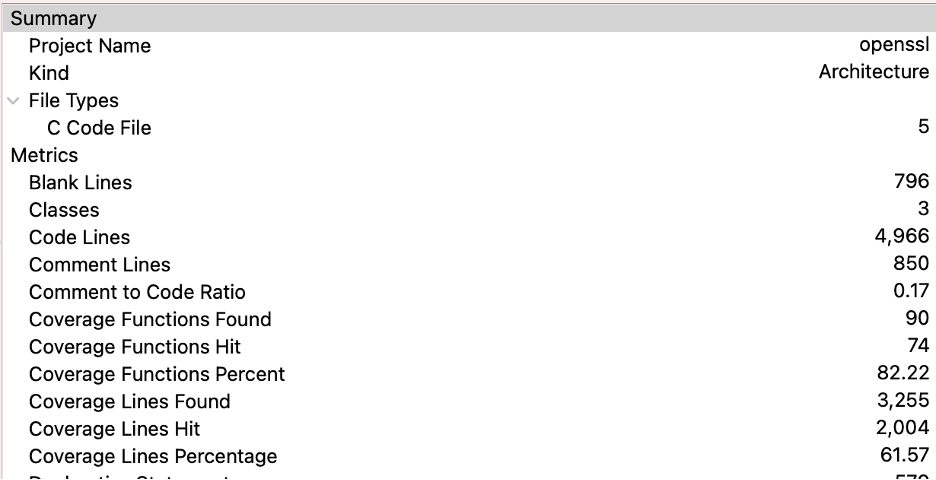
In the files last committed to by Dmitry Belyavskiy, 82% of the functions and 61% of the lines are tested.
Summary
This article has described how to create code coverage information, generate html reports, track coverage over call trees, graph coverage to compare it with cyclomatic complexity, and get coverage across custom groups. That’s not bad for someone like me whose only experience was a requirement on a school project. But I’m sure this is just the surface. We’d love to hear how you use code coverage information.


