TLDR:
Showing references in Understand graphical trees is a great way to hone in on the calls that built the tree as you debug or try to comprehend source code.
Details:
Here is the butterfly graph showing the Call and CallBys for the function AssignPeopleToPlaces() of the Imperial College COVID model that I’ve looked at in prior articles.
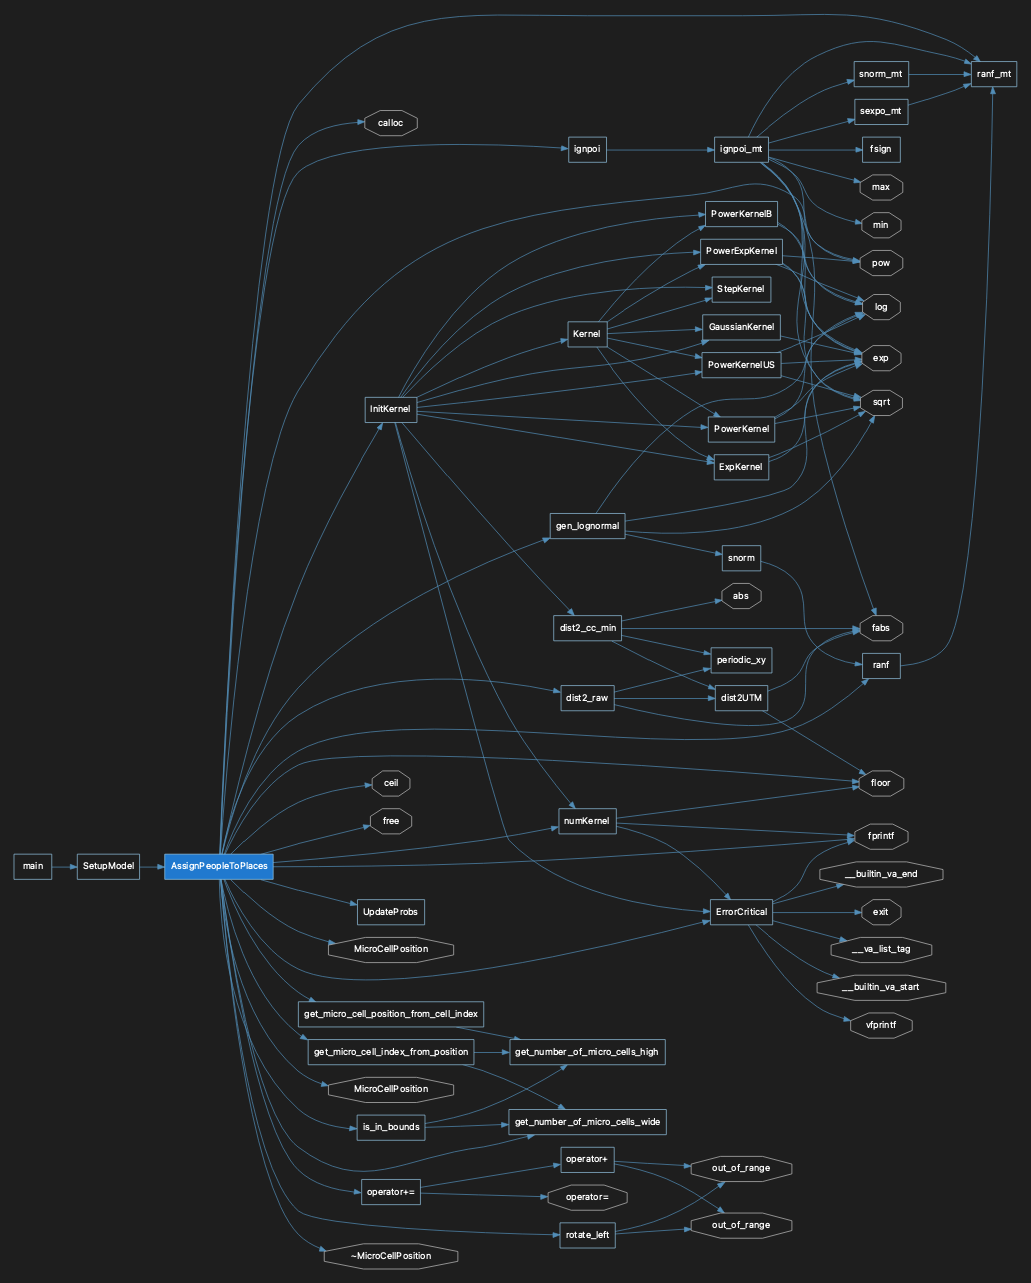
I’ve circled an area of interest, but where the graph is kind of confusing to read:
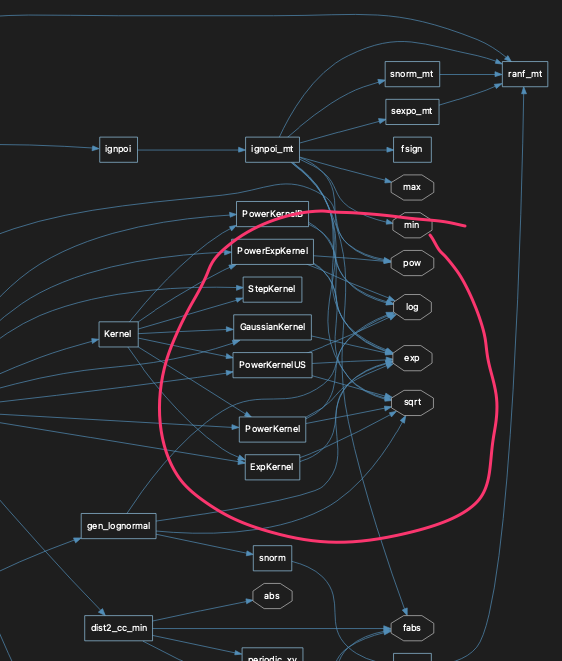
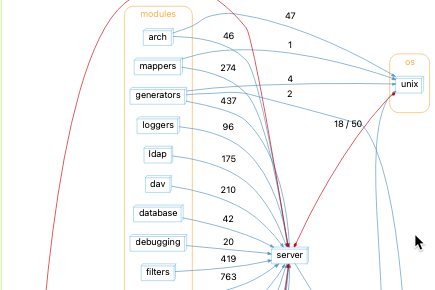
We already covered a way to demystify a confusing graph – the “Relationship Graph“. I’m going to do one of those between my function of interest and “exp()”:
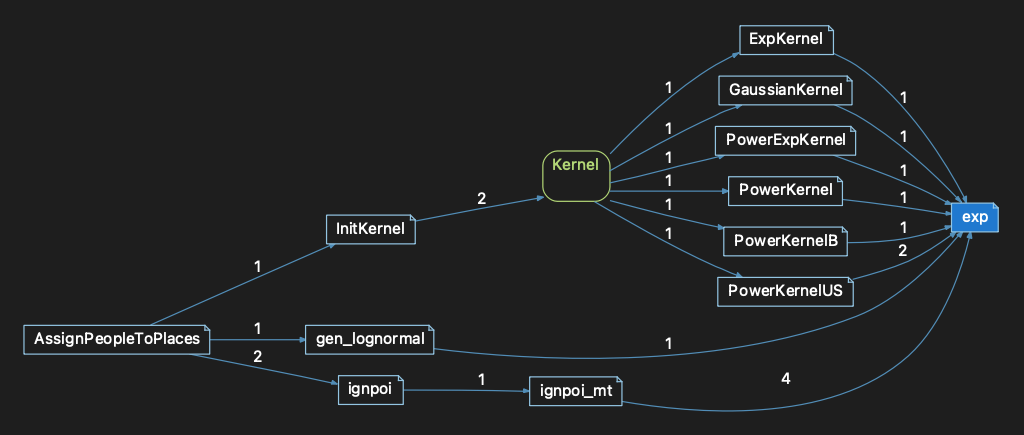
That’s better… this shows how the code can get from AssignPeopleToPlaces() to exp(), but what are those #’s on the edges of the graph?
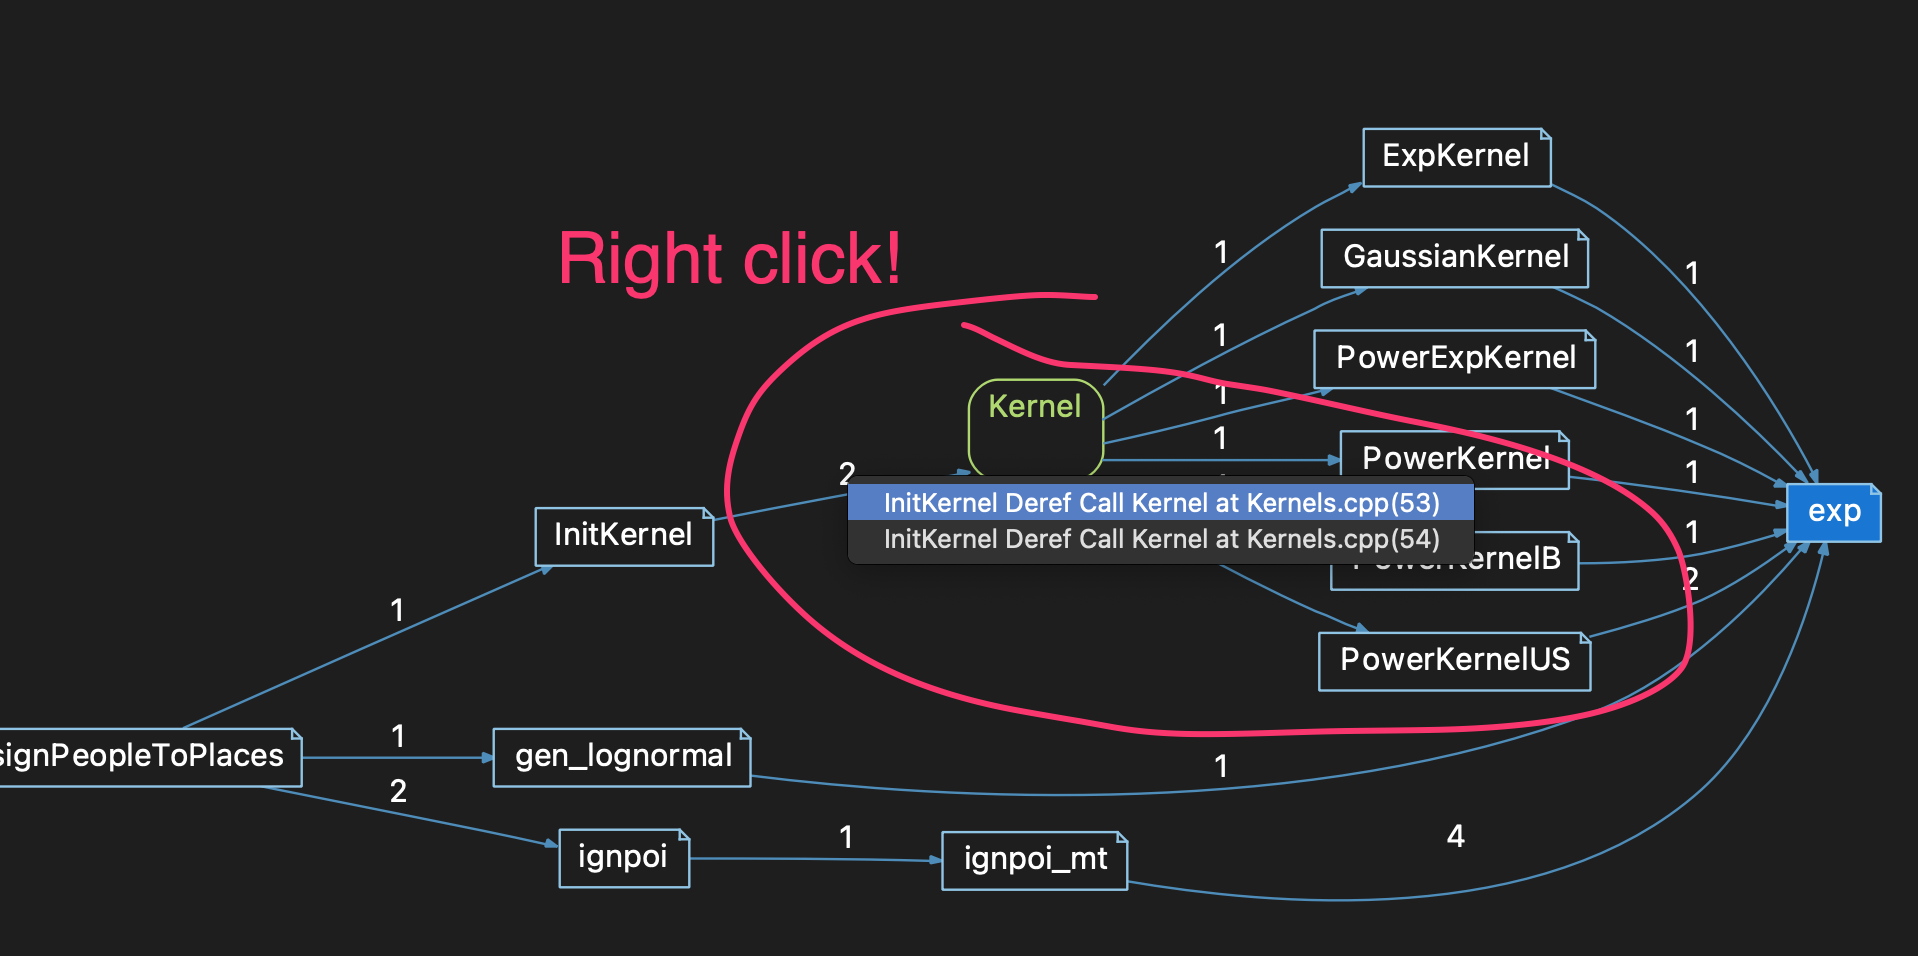
They are the number of call references made in the calling function to the next function down the graph. The # is interesting, for sure, but what would really be interesting as I walk this code are the actual calls.
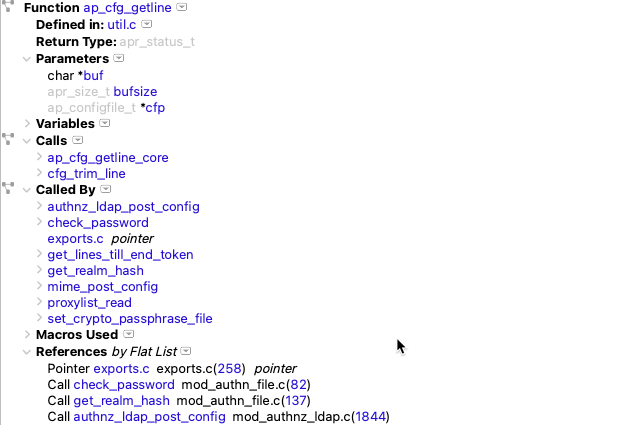
No problem… just Right Click on the # and the references magically appear:
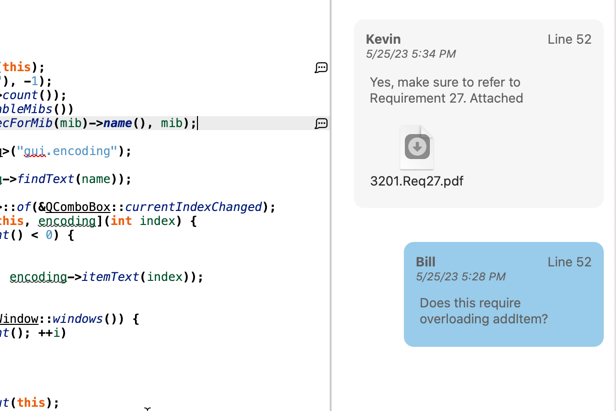
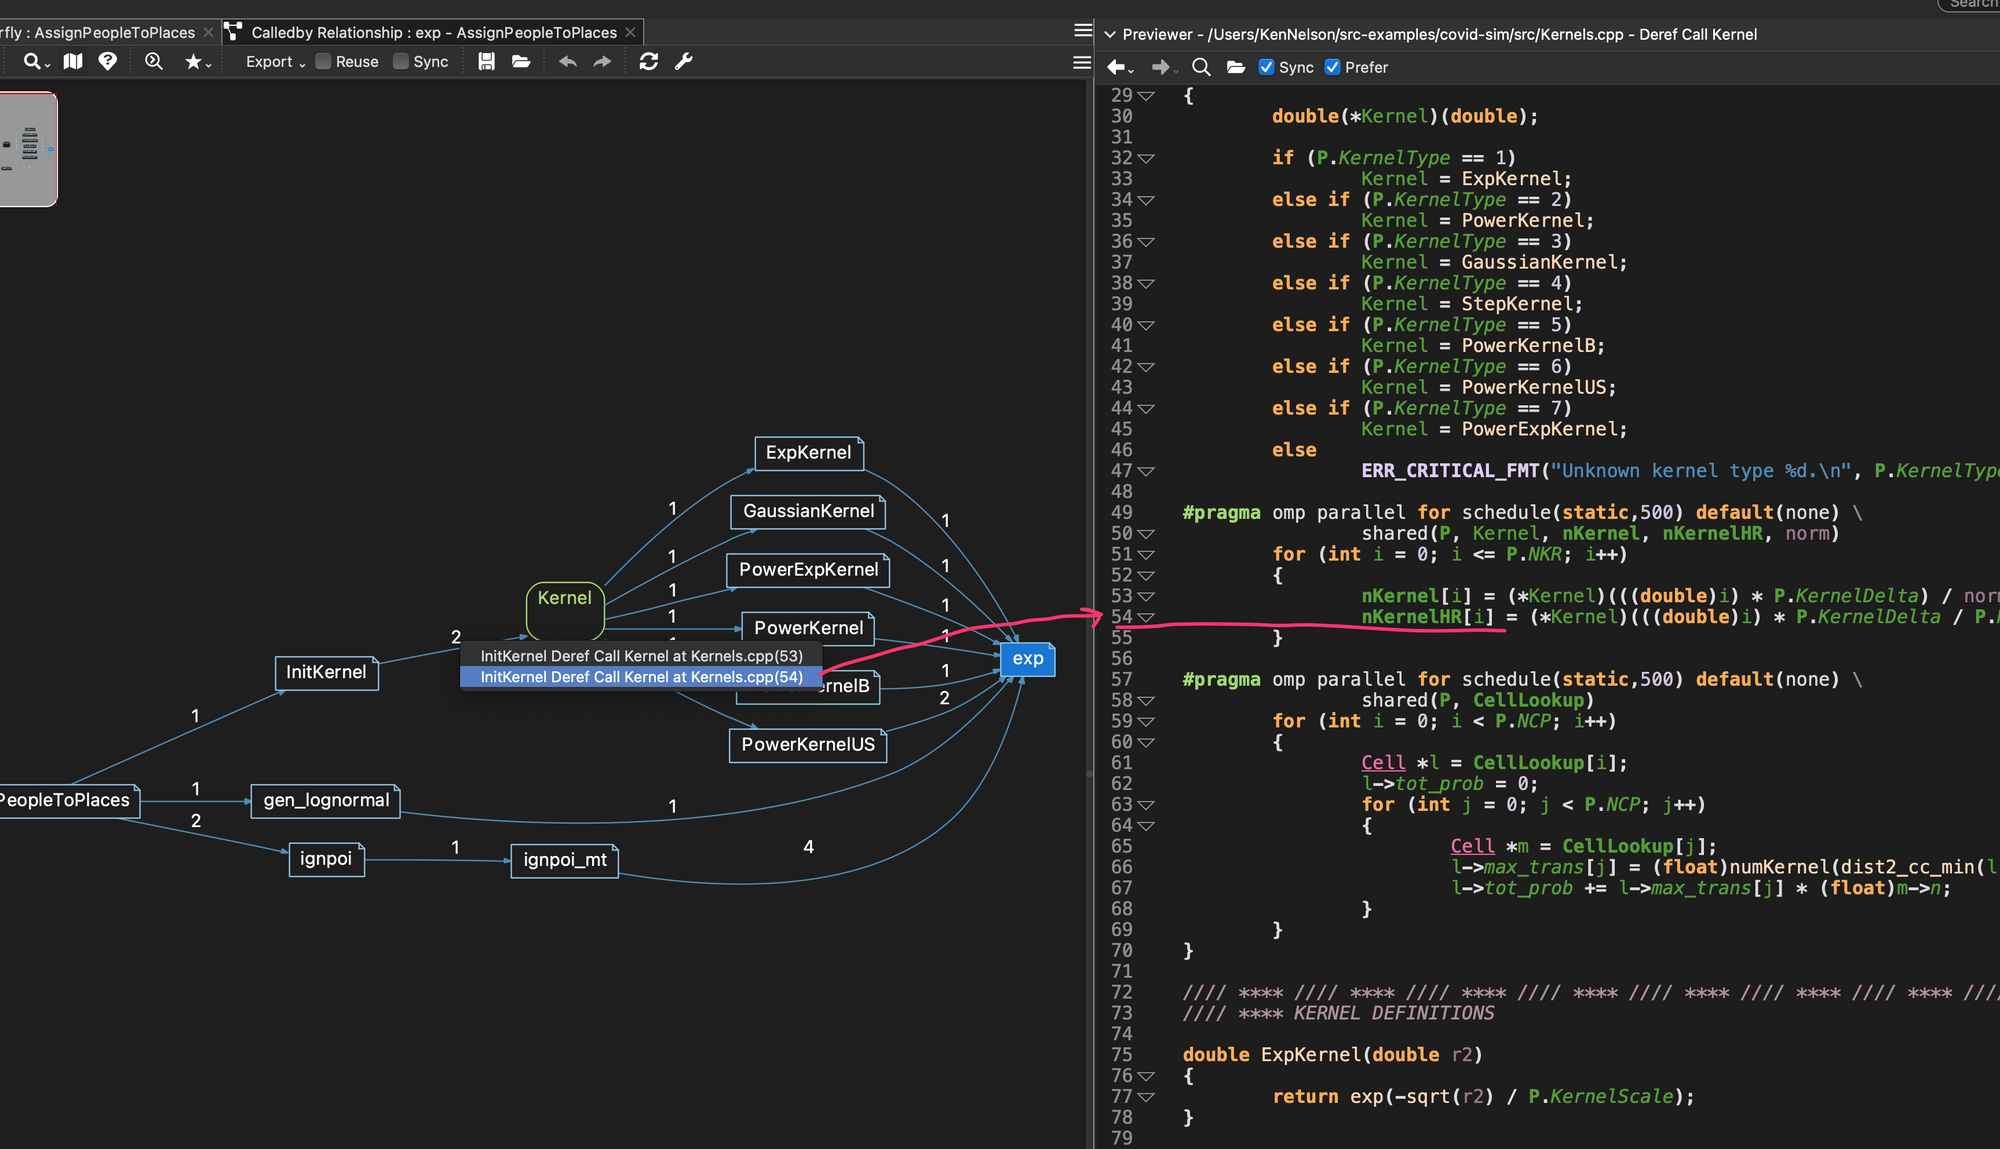
Now using a tool layout I showed you in my “Setup Understand for Awesome Code Browsing” article, I’ve got the Source Previewer (via View->Previewer) docked over on the right side, and [x] Sync and [Prefer] have it grabbing all the requests to show source.
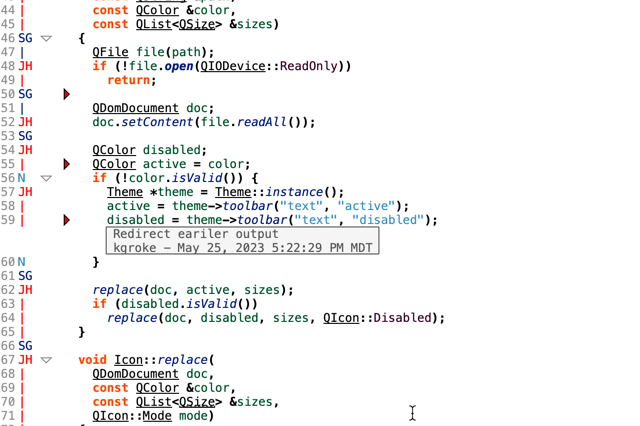
And now as I walk thru this reduced tree, right-clicking, I can visit each of the references for the call relationship between each node in the graph, seeing what the actual source code action looks like as I walk down the graph:
Summary:
I made a Call/CallBy butterfly graph of a function of interest, then reduced it using the “Relationship Graph”, and then walked the references that built the reduced graph showing the source for each reference as we go. Nice!