TLDR: Ken takes you on a tour of the flowcharts of functions with ascending Cyclomatic Complexity to visually show you how maintenance risk increases with Cyclomatic Complexity.
Details:
What is Cyclomatic Complexity?
There are mathematical explanations for Cyclomatic Complexity:
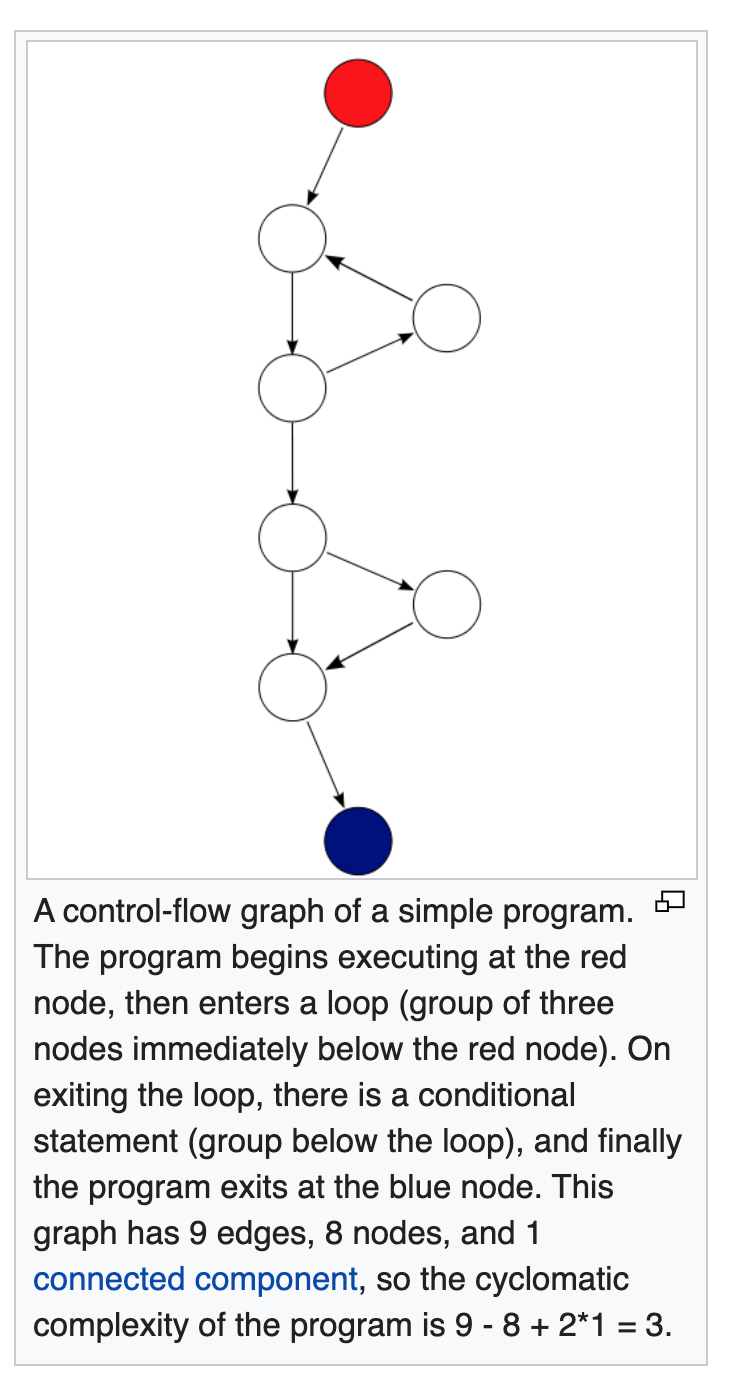
“Complexity = Number of Edges in a Graph – Number of Nodes + 2*(Number of Connected Components).
You can also explain it more naturally:
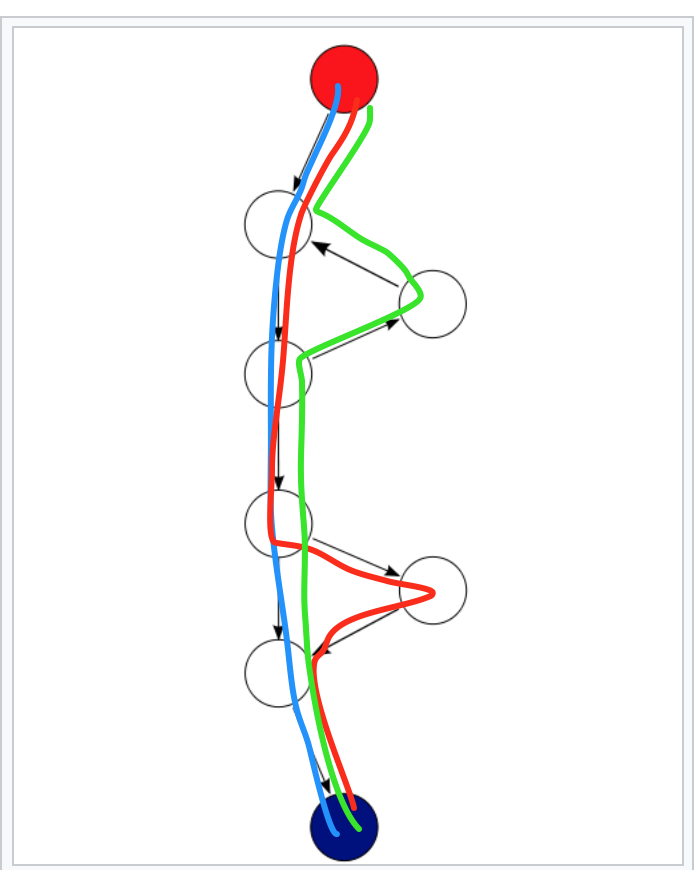
“the number of linearly independent paths through a program’s source code“.
The way I like to explain is that it’s the count of the minimum set of paths that lets you rebuild the entire function.
The usual recommended maximum value for Cyclomatic Complexity for a function is 10. This was set long ago based on studies of when bugs started to happen. I don’t think it’s an accident that 10 is also about the limit of a smart human’s short-term memory. You use that memory a lot when debugging and thinking about code when you are modifying it.
Visually Showing Cyclomatic Complexity
Maybe the best way to get across when Cyclomatic Complexity starts to affect development risk is visually, and that is what I’m going to show in this article.
I’ve analyzed the source code for the Covid Model from the Imperial College of London using Understand.
Let’s start at Cyclomatic Complexity of 1, and work our way up, visually comparing.
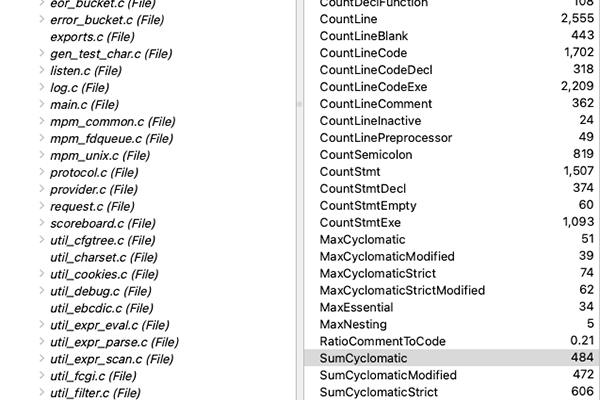
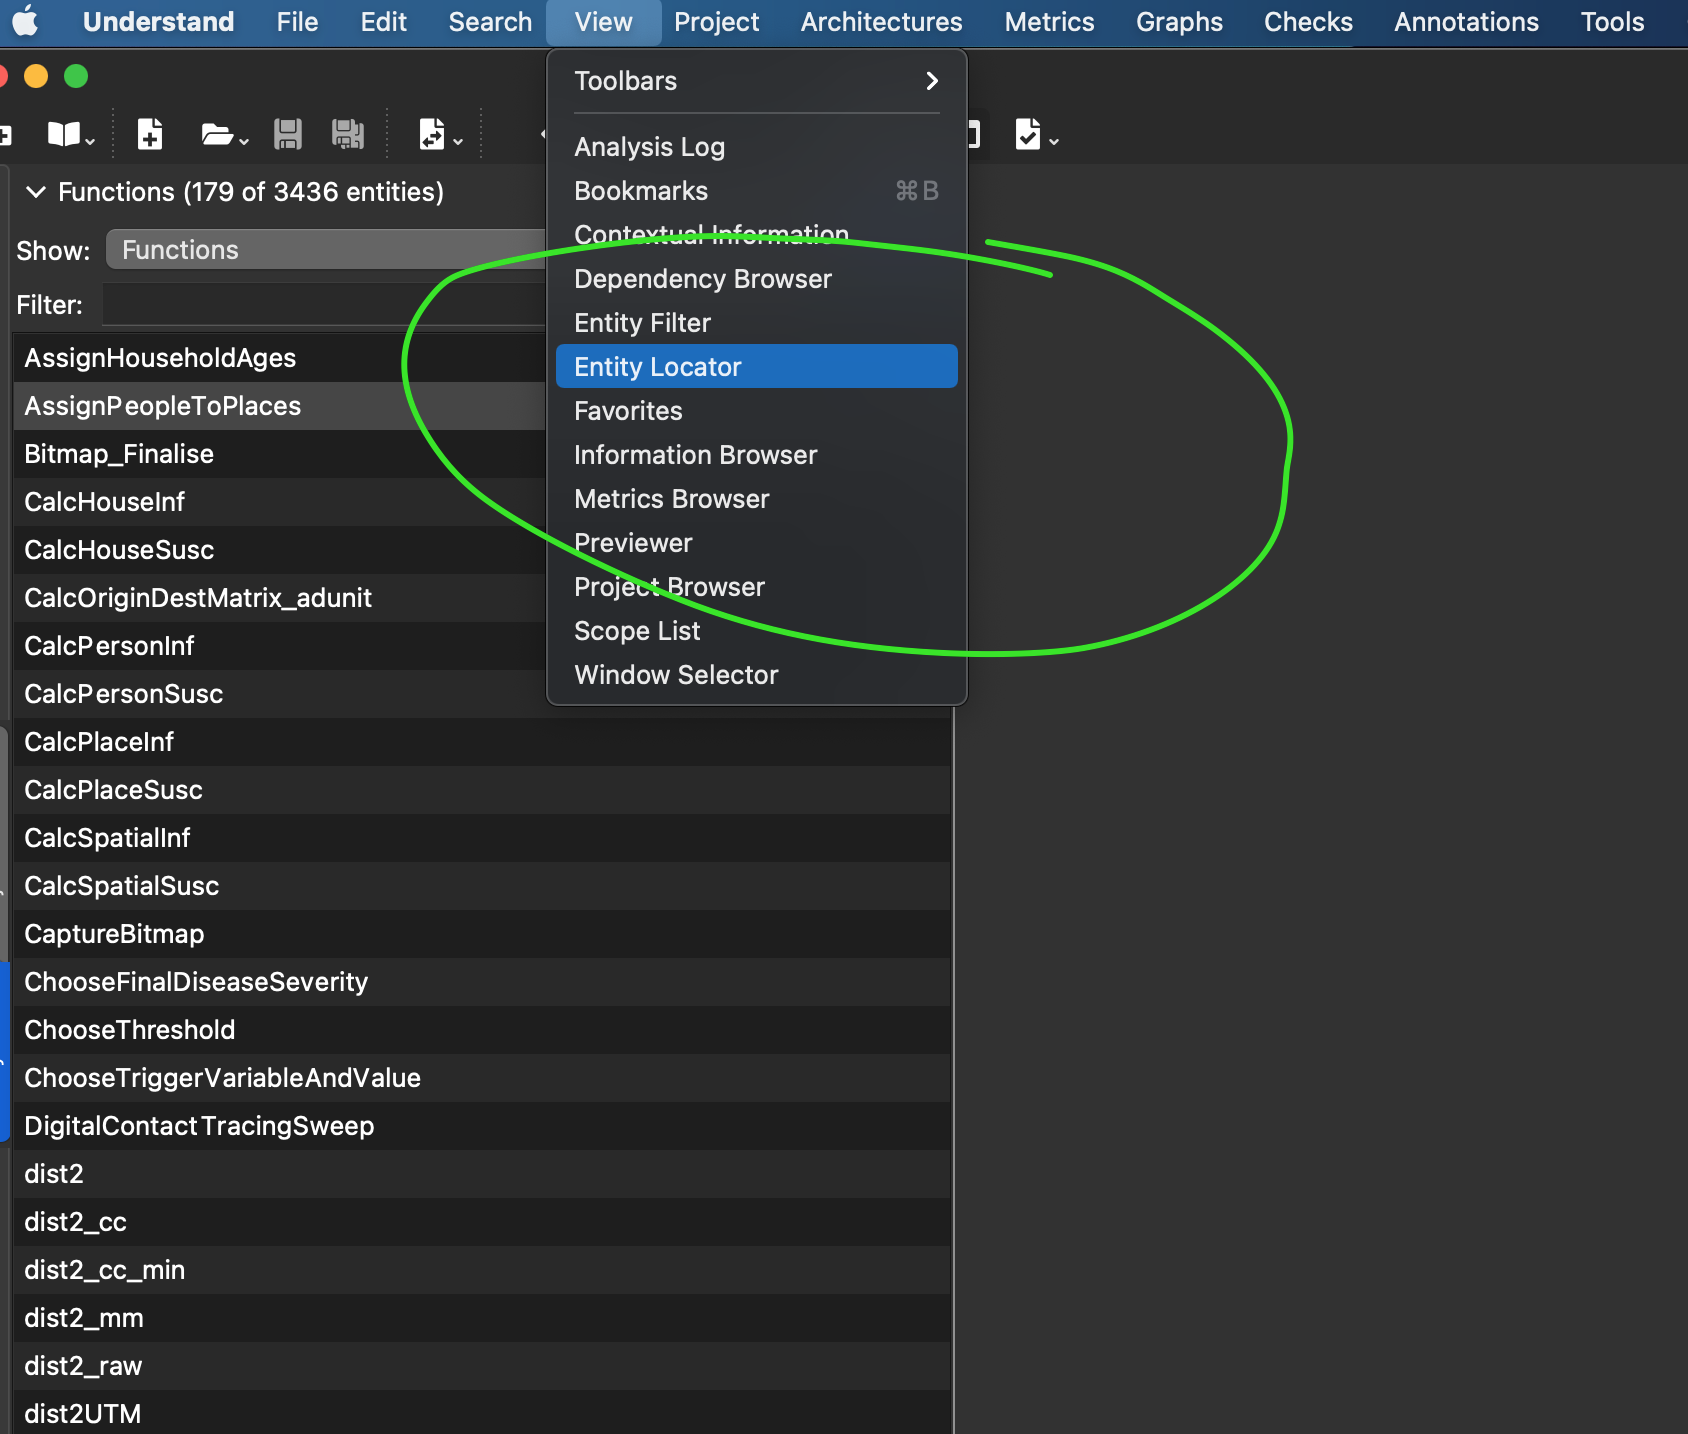
First off I’ll do “View->Entity Locator” and bring up a way to find all entities in the code.
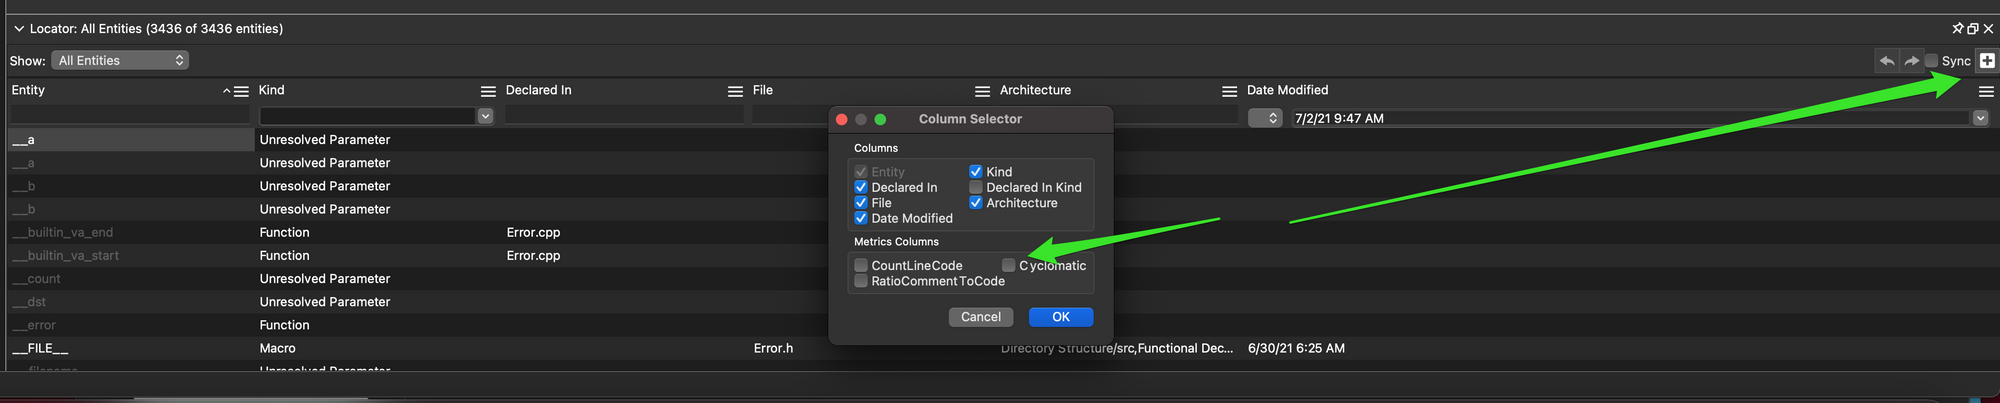
Once it is loaded, I’ll add a column for Complexity my set of filterable/sortable columns:
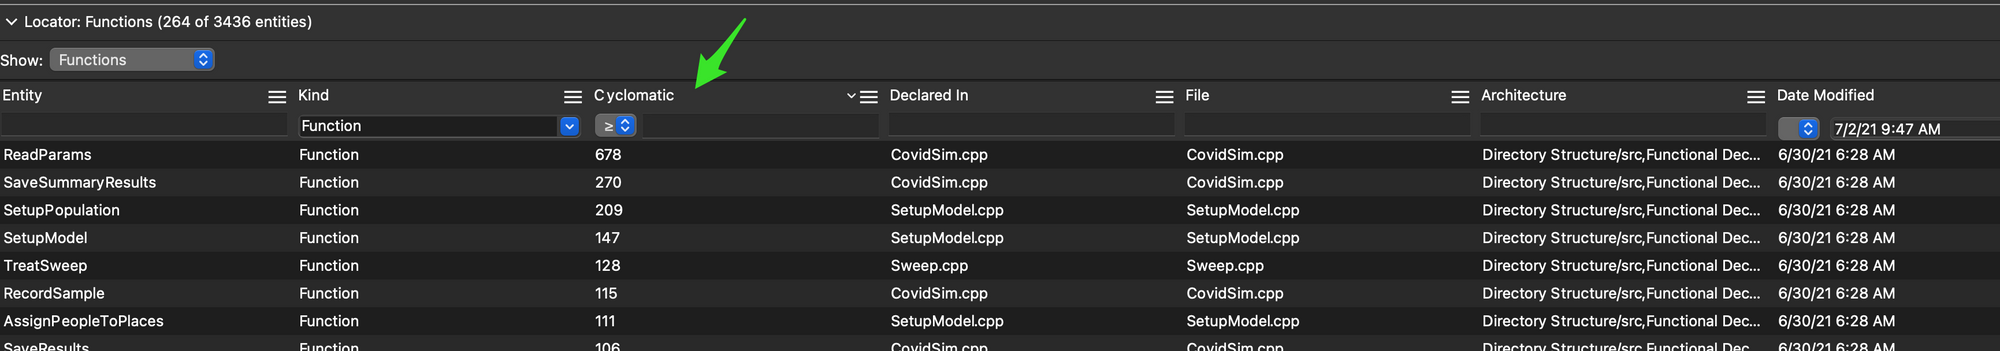
I end up with a way to sort, which I do descending.
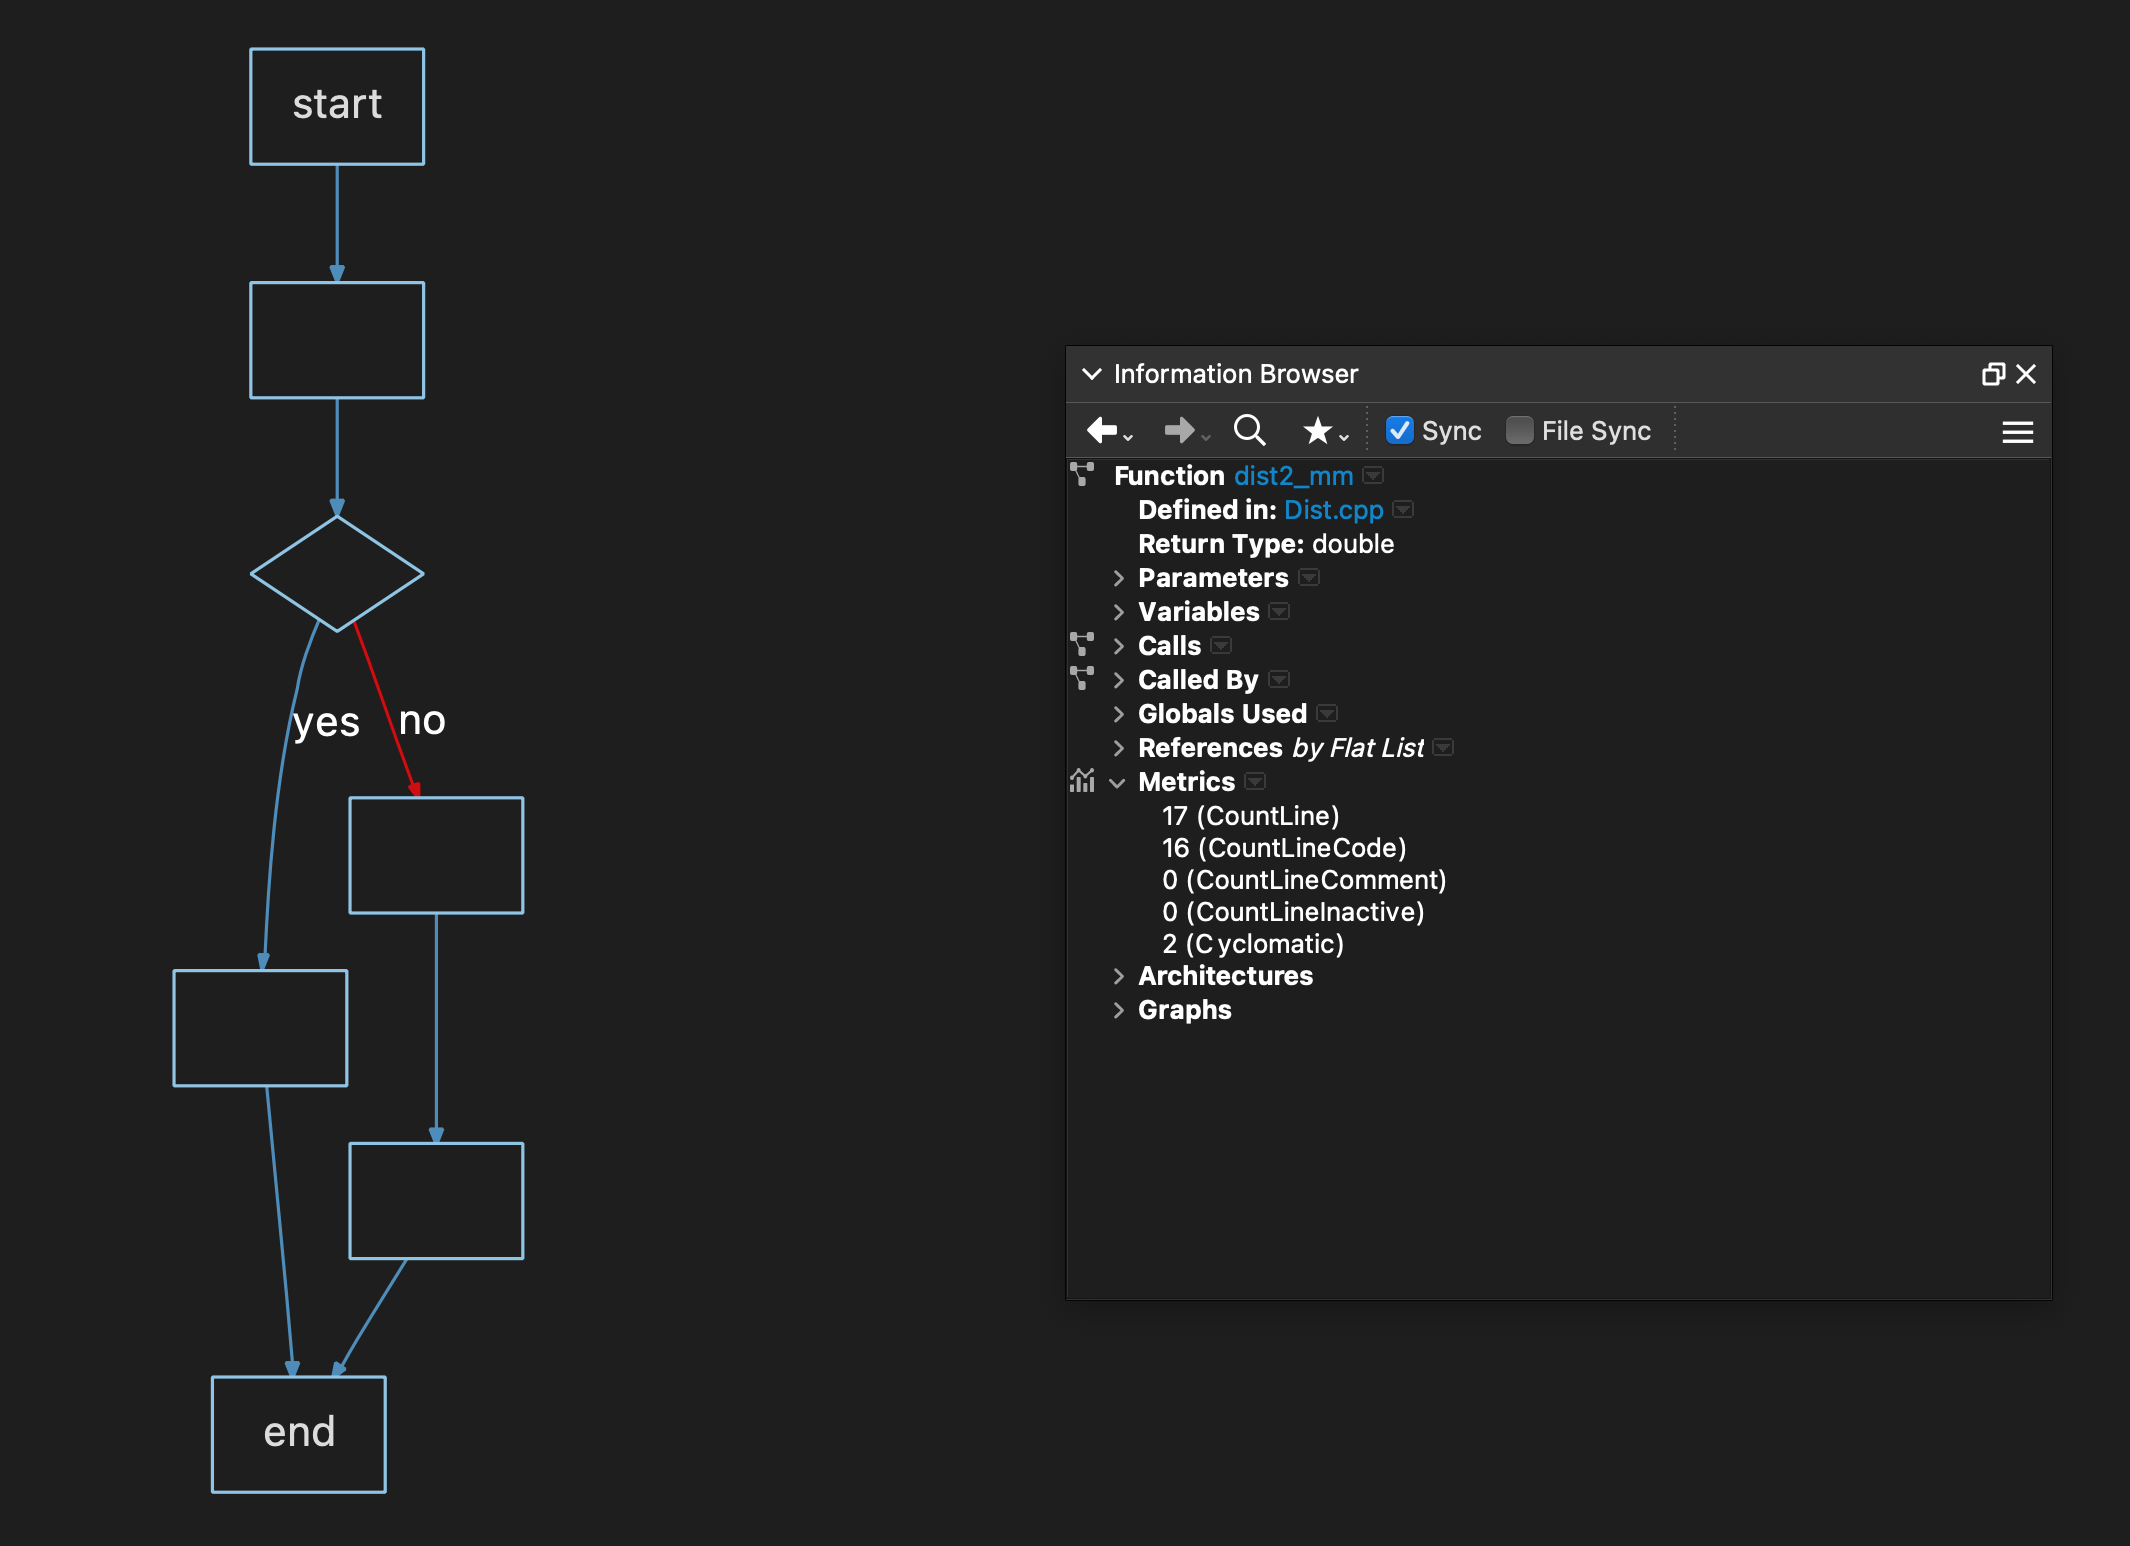
Complexity = 2
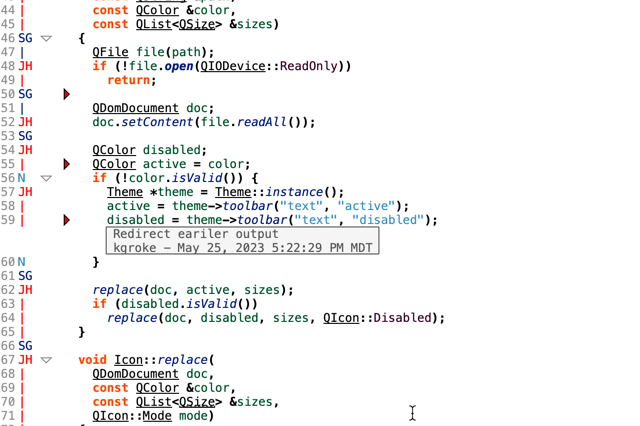
Here is what the simplest with any decisions will look like. This is function “dist2_mm” – with 17 lines of code. To show the logic I made a Control Flow graph of it with “skeletonize” option turned on – just to show the logic.
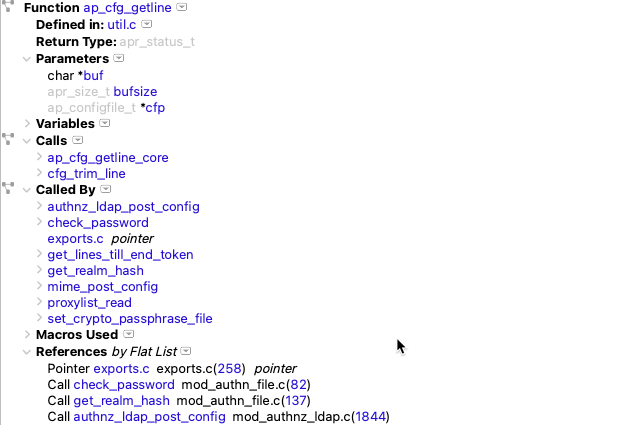
I also show the Information Browser for the function – the “IB” is where you can find almost everything Understand knows about the parts of your program.
Complexity = 3
This is what 3 looks like. Interestingly, this has less code, highlighting one of the uses of Cyclomatic Complexity as a measure of maintenance difficulties vs a less meaningful measure like pure Lines of Code. Thorny but less code could be harder to maintain than a lot of pure sequential code without decisions.
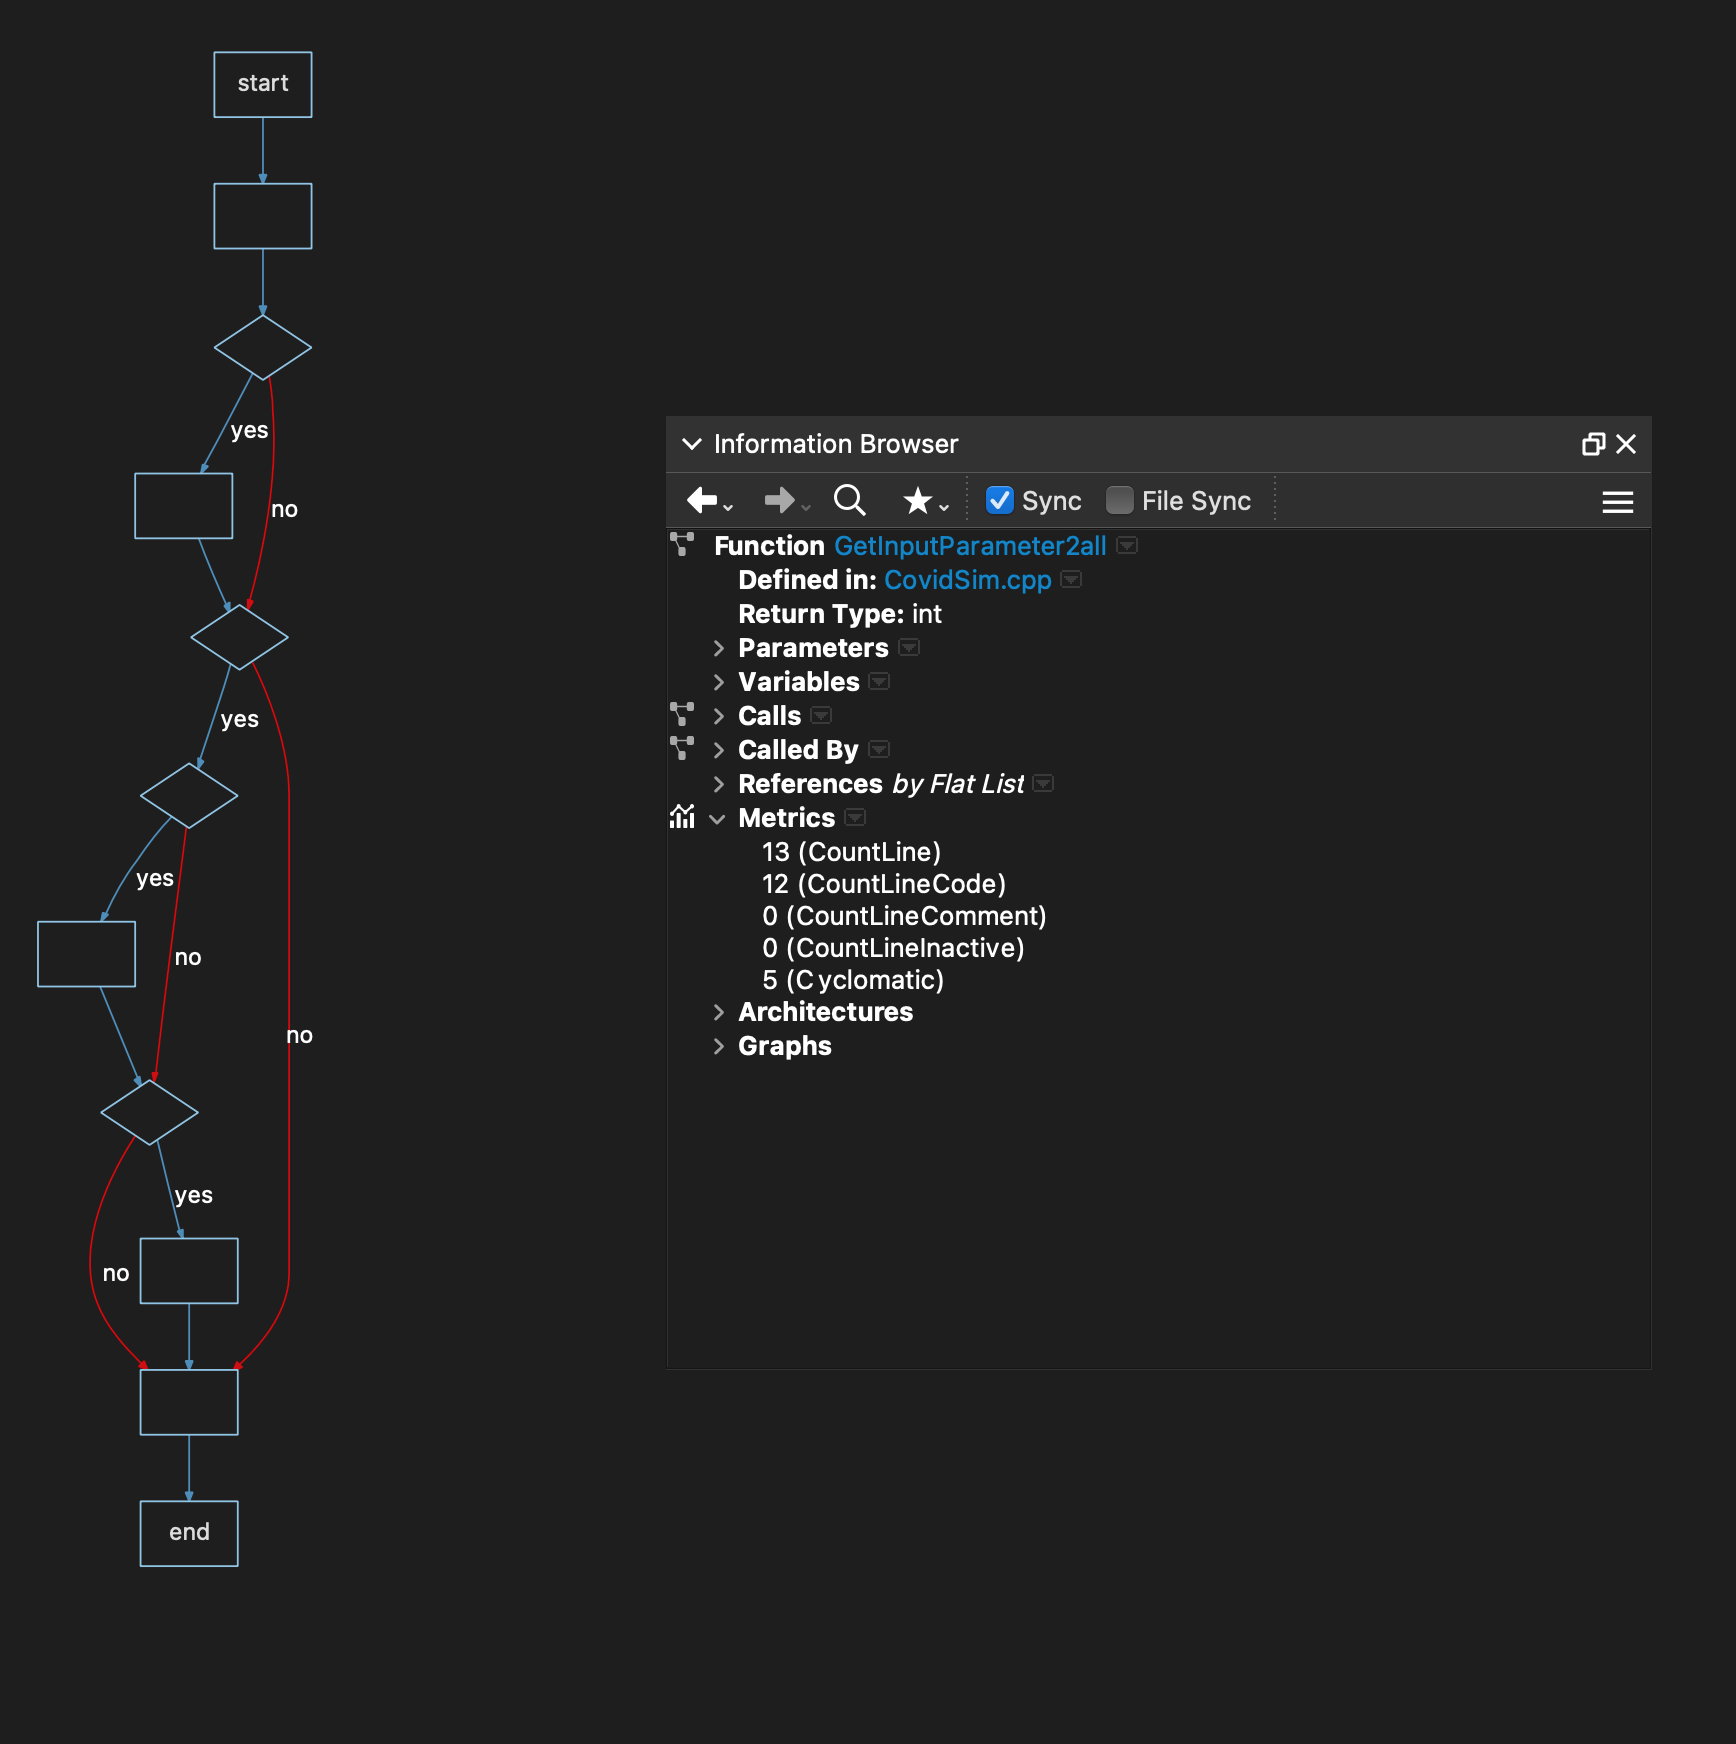
Complexity = 5
Let’s accelerate our tour, skip 4 and take a peek at 5. It looks manageable. Note that now we are starting to get to the lower limit of short-term memory, like when you are tired from pulling an all-nighter, or maybe after a relaxing bourbon (or 2 or 3).
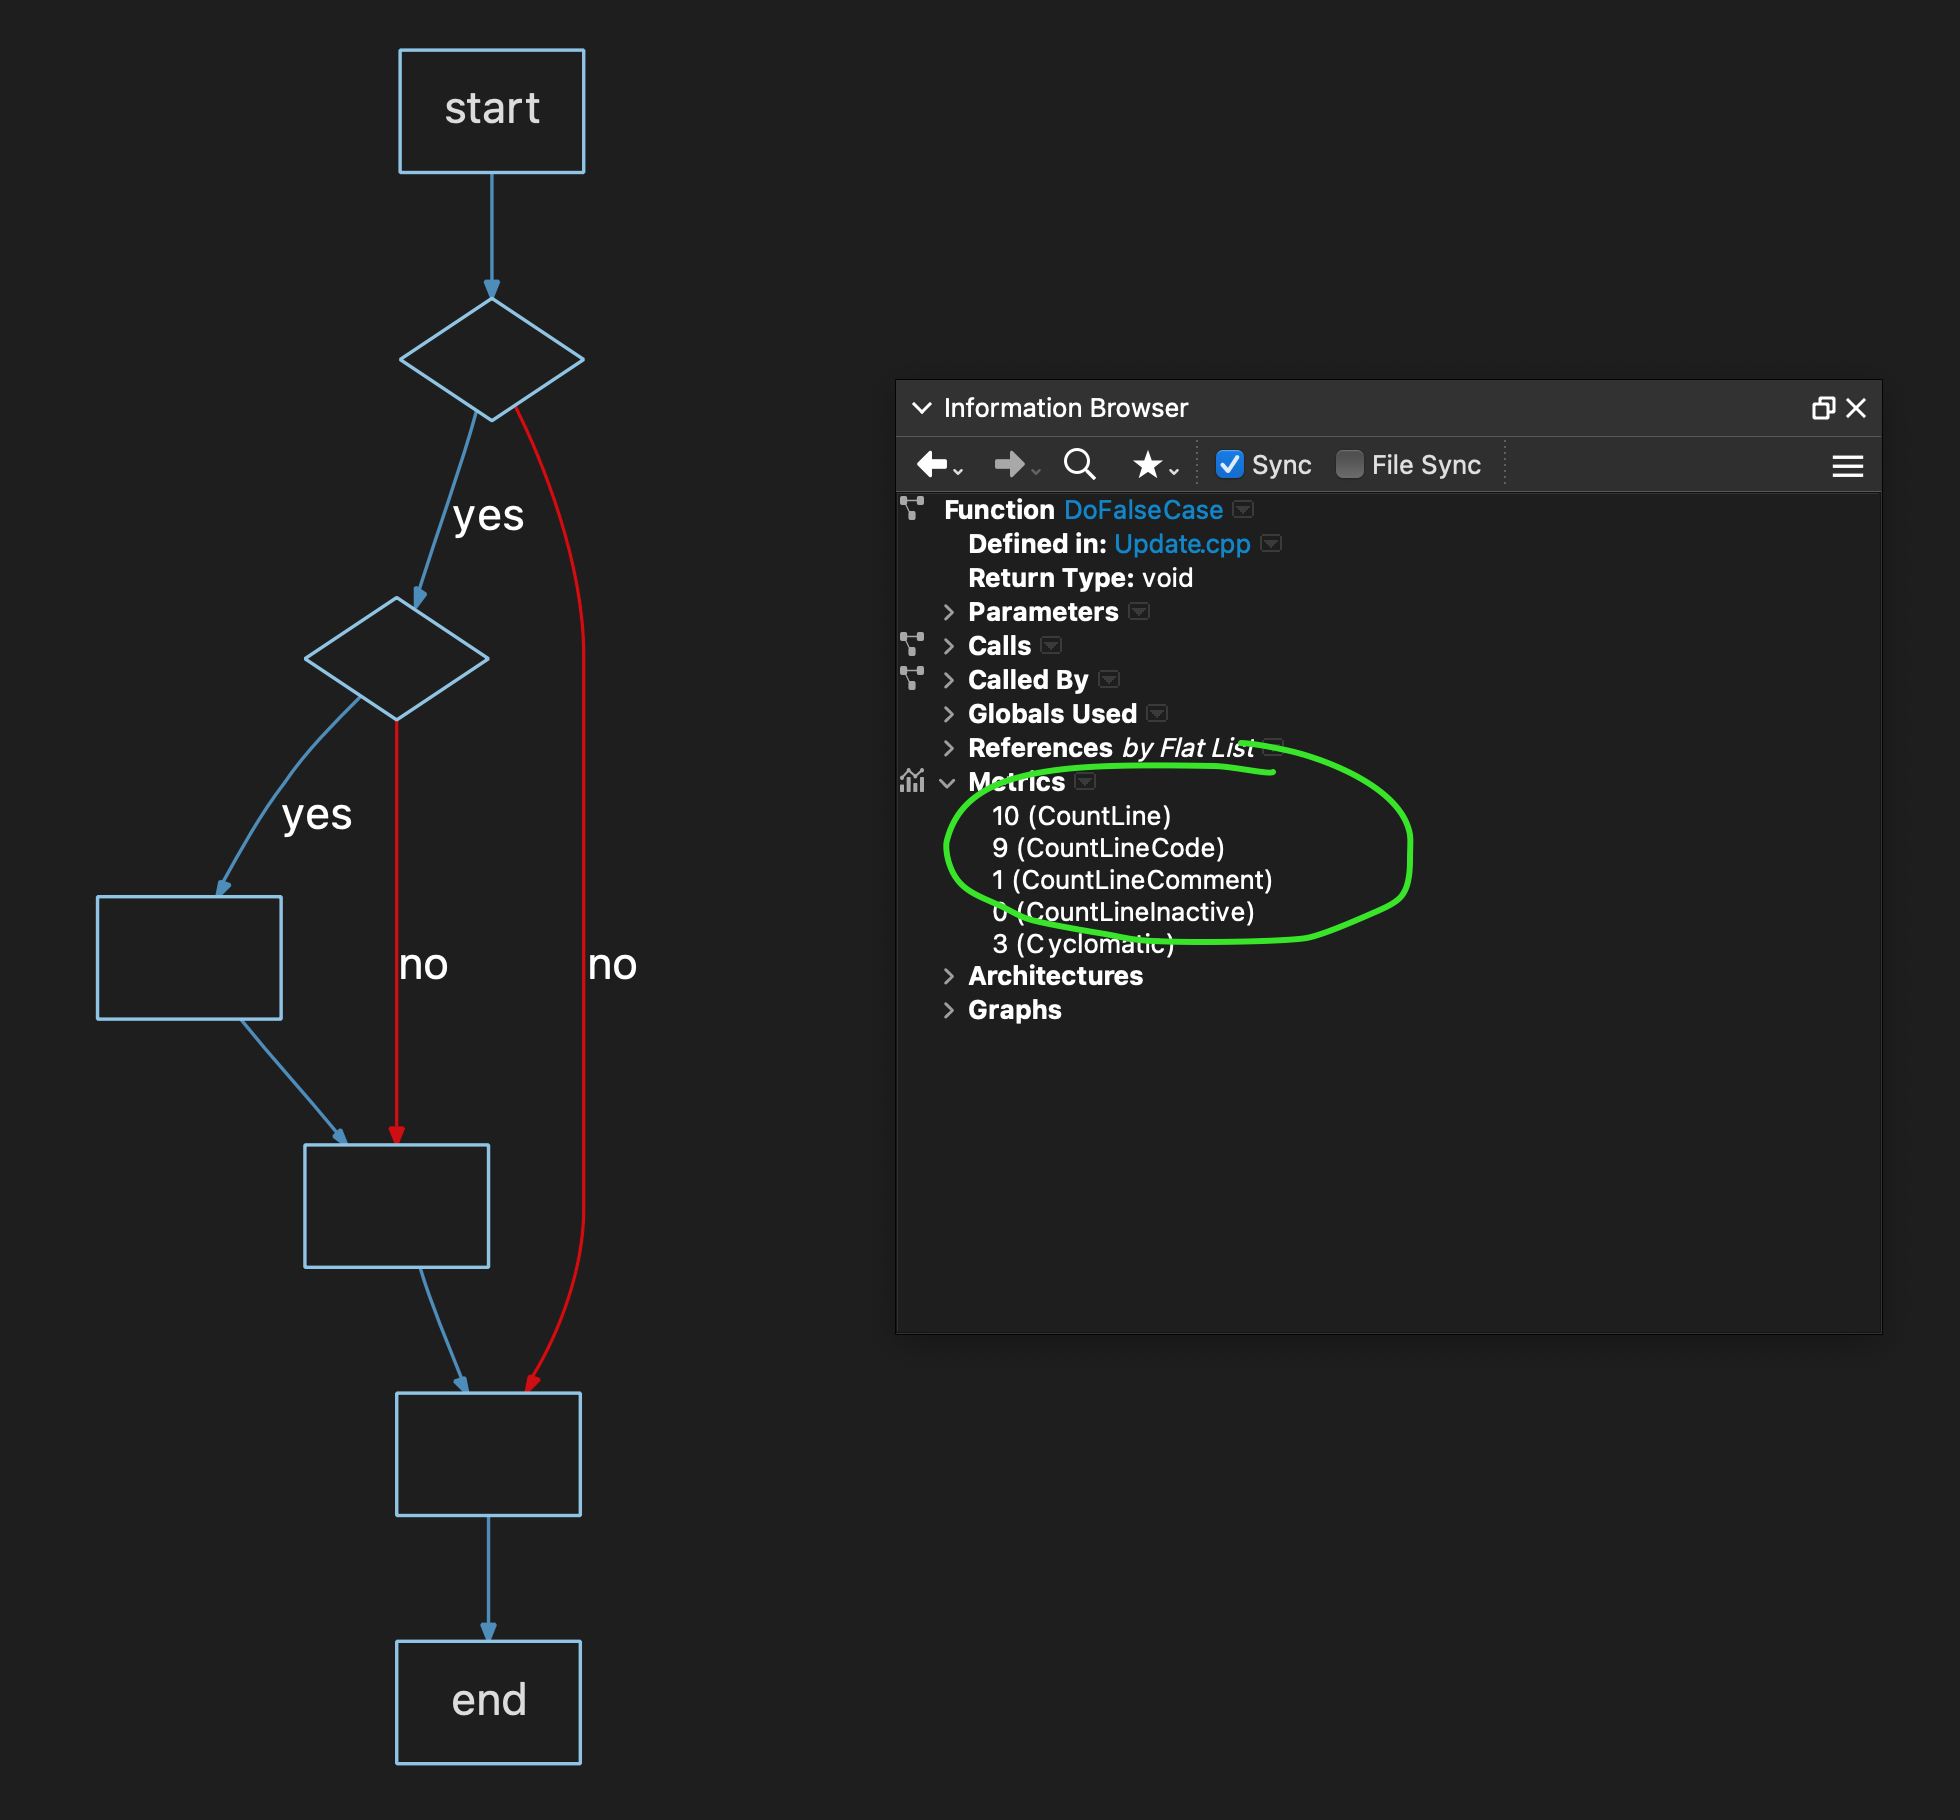
Complexity = 10
This is it… the “danger zone”. To make the graph as big as I can, I moved the Information Browser away – it would tell you though that this is just 36 lines of code.
What do you think? Would you have to think pretty hard to maintain this? It’s doable, for sure, but be careful.
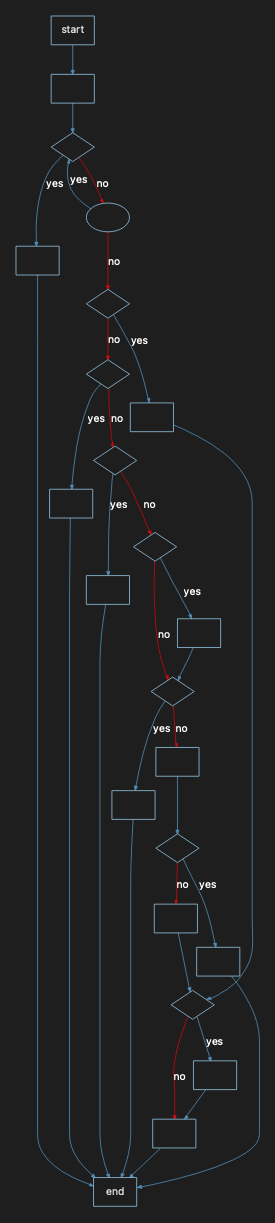
Complexity = 20
2x the Danger Zone – we are putting this visual tour of Cyclomatic Complexity into high gear! Would you say this is “maintainable” but perhaps any changes here should be well reviewed and planned? Note there are loops here too. Cyclomatic Complexity views those as decisions too.
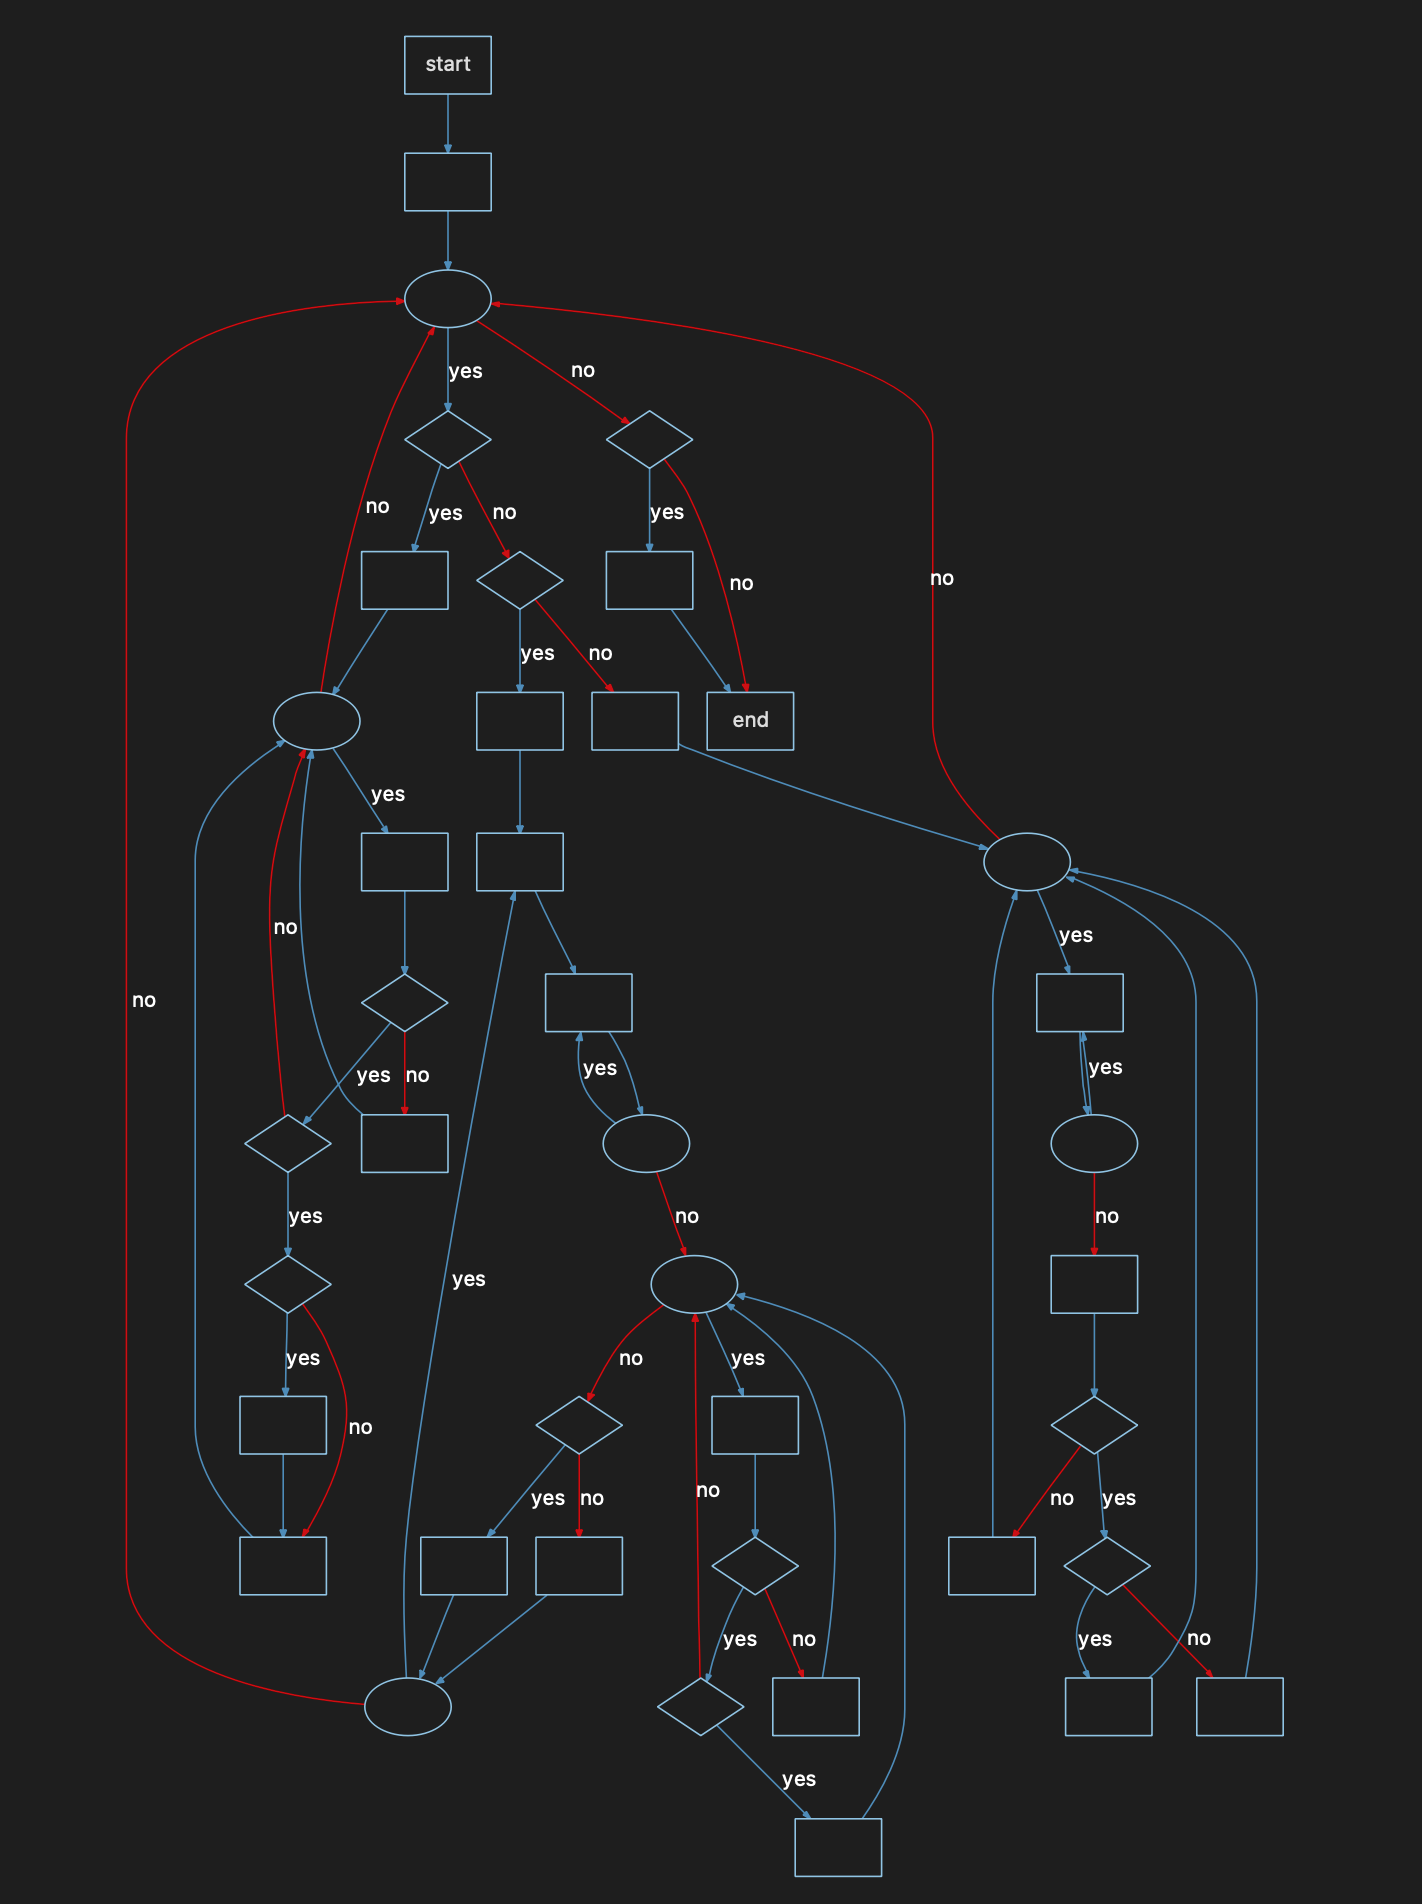
Complexity = 53
What about 50? Meh, I liked this graph better!
We’ve now entered the “re-factor” or “tread very carefully” zone. This is some sweet logic… and interestingly, when you look at the code, it’s an attempt to break up some even gnarlier logic – there are 3 “GetInputParameter#” functions but the other 2 are really simple. I like them better.
Cyclomatic Complexity = 102
Yes… still, we ascend. It’s gonna get hairy from here on in. Plus I chose Horizontal Layout, just to see what it looked like. It looks pretty scary this way too!
We are definitely in the “I don’t want to change this but my boss is probably gonna force me to” zone.
Complexity = 207
In Latin this would be “vere externauit spinosas Erycina” – or “really thorny”.
Not all “complexity” is equal, you might say, and that is true. For instance, conditionals that don’t have effects on each other and are just put in the same function for organizational purposes might not be so bad.
But that’s not how this function is. Its logic and data are coupled strongly meaning that changes upstream need to be accounted for downstream, and you probably aren’t gonna think of everything.
As an aside… the basis set of paths here is 207… the full set of logical paths thru this function is over a billion… and that’s only because we stop counting at a billion. It’s likely much much higher.
Complexity = 670
Alas, I can’t show you. My home office and older iMac (2014) with 16GB of RAM can’t draw it.
Suffice to say… function ReadParams with a complexity of 670 and 1586 lines of code would be a challenge and quite a risk to maintain.
Summary
Visually seeing the complexity highlights the risks of maintaining code where complexity gets past 10 or 20. You can do it, but plan for testing, collaboration, and a longer development as you consider possible side-effects downstream logic might have.