Abstract
A bug in the control flow graph is solved using the Git blame margin in Understand to quickly find a related fix in a recent commit.
Details
In preparation for a major Japanese release of Understand, we’ve been fixing a lot of bugs related to Unicode characters. Here’s one where Git really helped.
The bug was found in control flow graphs from files with multibyte comments. Here’s the sample file and a portion of the control flow graph for func.

The first two lines of information on each node are shown because the “Debug” right-click menu option is on. Control flow information is calculated during analysis and stored as part of an entity’s free text. (Bonus: this means any user can get the same information from the API). The first line is calculated by the graph with the number of the node (1 based instead of 0 based) and a string describing the type. The second line is the raw list of numbers for that node stored by the parser. The numbers are:
- An enumerated type for the node. 36 is passive-implicit and 35 is passive.
- Start Line
- Start Column
- End Line
- End Column
- End Node, if applicable. This applies to structures like if statements or loops.
- Edges out (there can be more than one).
There are two problems with this graph that turned out to have different underlying causes. The first problem is in the third node, where the comment is missing the final character.

The second problem is in the fourth node where the “settings2()” line is missing entirely.

For a control flow graph text bug, there are three major areas where the error could be happening. First, the column and line numbers in the control flow graph could be wrong. However, comments aren’t included in the control flow graph ranges so that isn’t the problem for the truncated comment. A quick look at the debug information shows that isn’t the problem for the missing “settings2()” text either, since line 11 columns 2-11 is the correct range for “settings2().” By the way, columns reported in the control flow graph assume a tab-width of 8 characters.
The second possible problem area is looking up the range reported by the control flow graph in the lexer. I can quickly print out the lexer information for the file using the python API.
natasha$ python
>>> import understand
>>> db = understand.open("tech-matrix-333.und")
>>> file = db.ents("file")[0]
>>> file
@l./sample.c
>>> for lexeme in file.lexer():
...     print(lexeme.token(), lexeme.line_begin(), lexeme.column_begin(), lexeme.line_end(), lexeme.column_end(), lexeme.text())
The printout for lines 7 through 12 is:
Whitespace 7 0 7 1
Comment 7 2 7 7 // 設定
Newline 7 8 7 8

Whitespace 8 0 8 1
Identifier 8 2 8 9 setting1
Punctuation 8 10 8 10 (
Punctuation 8 11 8 11 )
Punctuation 8 12 8 12 ;
Newline 8 13 8 13

Newline 9 0 9 0

Whitespace 10 0 10 1
Comment 10 2 10 7 // 設定
Newline 11 0 11 0

Whitespace 12 0 12 1
Identifier 12 2 12 9 setting2
Punctuation 12 10 12 10 (
Punctuation 12 11 12 11 )
Punctuation 12 12 12 12 ;
Newline 12 13 12 13
The missing “settings2()” text is a lexer problem, identifiable in the printout because line 10 didn’t have a newline, and line 11 became line 12. I reported this to the parser engineer and he fixed that issue. However, the lexer range is correct for the comment on line 7 and it has the full text. In fact, turning off styled labels so the lexer text is used directly fixes this particular problem in the control flow graph.
So the truncated comment on line 7 is likely a problem in the conversion from lexer ranges to editor ranges to get the text styling. Graphs have their own editor-rich text code because they use a limited set of HTML tags. Looking at the graph code for converting lexer ranges to editor ranges, the column numbers are off because bytes and characters as treated as the same thing which doesn’t work for multibyte characters.
int min = mEditor.positionFromLine(start.line) + start.column;
int max = mEditor.positionFromLine(end.line) + end.column + 1;
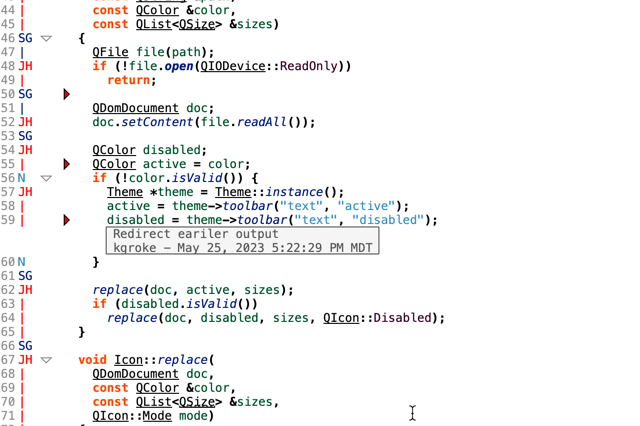
Here’s where Git comes in. In fixing this for the graph code, I can start by looking at the full rich text code (not used by graphs):

I have the blame margin turned on by default (Tools->Options->Editor page, margins section).

The blame margin is heatmap colored, so my eye is drawn to the more recent changes. Using blame like this I can quickly see that the recent multibyte fix converts the column number to bytes to get the correct range. So I’ll change this graph to do the same thing. The updated graph code should be:
int sCol = mEditor.lineText(start.line).left(start.column).toUtf8().size();
int eCol = mEditor.lineText(end.line).left(end.column).toUtf8().size();
int min = mEditor.positionFromLine(start.line) + sCol;
int max = mEditor.positionFromLine(end.line) + eCol + 1;
I prefer having the blame margin on all the time, but it can also be turned on for the current file from the editor toolbar.

Or, there’s an inline blame option available from Tools->Options->Editor->Advanced.

With both the range conversion fix shown above and the lexer fix done by another engineer, this week’s build (1074) will now display control flow graphs correctly for files with multibyte characters in comments.


