Abstract: Part 2 of a 5 article series about using Understand to analyze how a CMake-based project has changed over time. This article focuses on using Understand’s command-line tools to create 200+ comparison databases and constructing a trend line of analysis errors over time.
Understand’s comparison projects are a great way to get a point-to-point comparison. But, what if I have more than two-time points? In that case, I would need an Understand database for each time point I’m interested in. Then, I could get an overview by plotting a trendline with relevant metrics.
So, how to create a bunch of comparison databases en mass? I’m going to use the GitAhead sample project because I already have comparison databases at the beginning and the end, (see part 1) so I know what kind of problems to expect. Running the command below I can see that it also has a conveniently short history of only 380 commits.
$ git log --pretty=oneline | wc -l
     380
Time & Space Requirements
Before jumping in, it’s worth considering how much time and space such a project would take. For time, the analysis log includes a line about elapsed time. The Git comparison project I already have (the final version with 66 errors) takes 51.161 seconds to analyze all. So, creating 380 databases at about 1 minute per database will take 6 hours 20 minutes.
What are the space requirements? To make Understand projects more shareable, the .und folder only contains configuration files. This means you can check the .und folder into a git repository to share settings between users. It also means it’s a little hard to know exactly how much space an Understand project is taking up. The path to the local data for an Understand project can be found with this und command:
und projectinfo gitahead.und
Current Build (Build 1094)  January 17, 2022
Project Name: /Users/natasha/projects/Sample/gitahead/gitahead.und
Last Analysis: 1/18/22 9:28 AM
Database Version: created=1018, modified=1092
Internal Directory: /Users/natasha/Library/Application Support/Scitools/Db/e92f7f4fce7c4bbfc97a27e21690db5b
Of the files in that e92f7f4f… folder, the largest one is parse.udb which contains the parse data
Natashas-MacBook-Pro:gitahead natasha$ ls -lh "/Users/natasha/Library/Application Support/Scitools/Db/e92f7f4fce7c4bbfc97a27e21690db5b"
total 104208
-rw-r--r--  1 natasha  staff   103K Jan  3 09:57 CCFileAnalysis.dat
-rw-r--r--  1 natasha  staff   123B Jan  3 10:01 CCMyLocalChecks.json
-rw-r--r--  1 natasha  staff    36B Jan  3 09:57 CCSettings.dat
drwxr-xr-x  3 natasha  staff    96B May 12  2021 codecheck
-rw-r--r--  1 natasha  staff   8.2K Jan 17 10:46 favorites.dat
-rw-r--r--  1 natasha  staff    31B Jan 17 10:45 namedroots.json
-rw-r--r--  1 natasha  staff    48M Jan 18 09:28 parse.udb
-rw-r--r--  1 natasha  staff    52B Jul  1  2020 project.txt
-rw-r--r--  1 natasha  staff    46K Jan 18 11:46 projectmetrics.dat
-rw-r--r--@ 1 natasha  staff   187K Jan 18 11:46 session.json
-rw-r--r--@ 1 natasha  staff   420K Apr 29  2021 session_backup.json
-rw-r--r--  1 natasha  staff   1.0M Jan 18 09:28 settings.xml
-rw-r--r--  1 natasha  staff   1.0M Mar 18  2021 settings_all.xml
It’s around 50 MB at the current time point and 30 MB at the earliest time point. So, estimating at 40 MB per project multiplied by 380 time points is 15200 MB or about 15 GB.
Picking Commits
Hmm, 15 GB and over 6 hours. It’s probably worth checking how many of those 380 time points are necessary. First, I can ignore merge commits since I only need to see each change once. I’m assuming that most merge commits didn’t have conflicts or other changes.
$ git log --pretty=oneline --no-merges | wc -l
     304
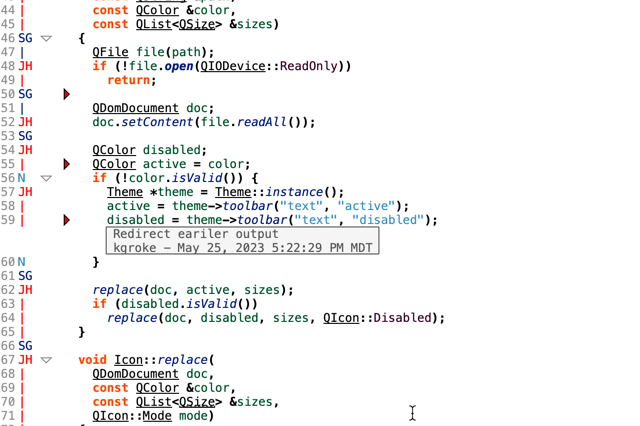
That leaves 304 possible commits. Glancing through the commits with GitAhead reveals another factor to consider. Understand only parses code files. In this case, c/c++ files. In the commit below, the only changed files are CMakeLists.txt and a documentation file. A project at this time point would be identical to the time point before it.

It isn’t a hundred percent safe to ignore all changes to non-code files. Some changes to CMakeFiles might impact the build system. At least for this first run through, I’ll decide interesting commits by hand. Then I might be able to find a pattern to automate the process. I’ll use a spreadsheet to keep my notes since I like using Microsoft Excel. I can use git log to build the base of the spreadsheet:
$ git log --pretty=format:%h,%an,%ad,%s > ~/projects/debugOutput/gitahead_commits.csv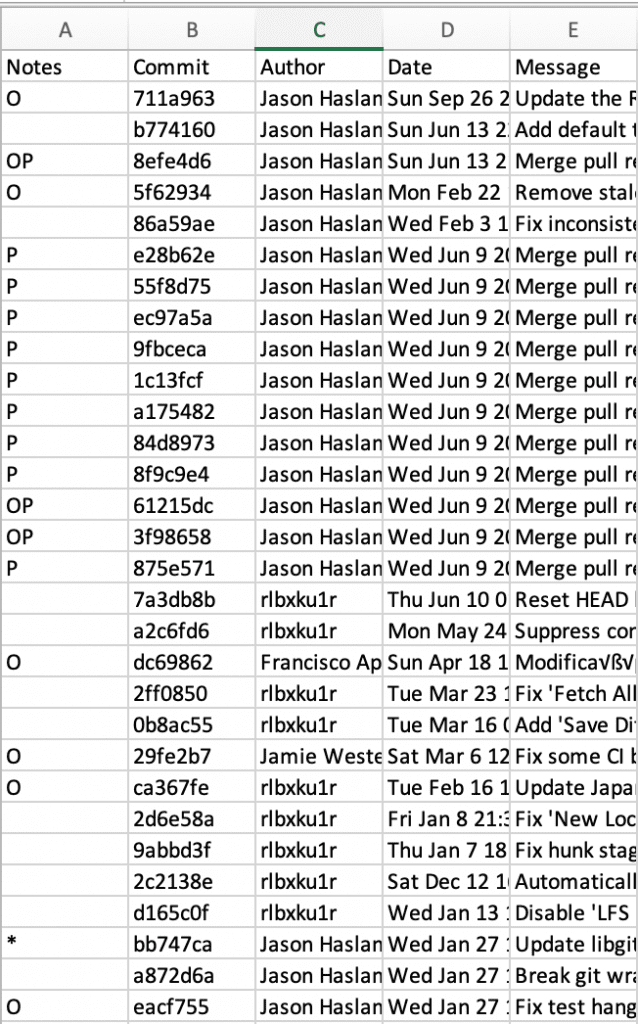
For notes, my admittedly cryptic scheme is O for nothing interesting, P for a pull request and * for a point where a library changed. Library changes indicate I might need to update the cmake compile_commands.json file at that time point. In the end, I have 204 “interesting” commits selected.
Batch Processing
Even after eliminating over one third of the potential commits, I have more commits than I want to process through the gui. I’d like a command line batch script to make all the databases for me. The command-line-tool und’s create command has flags to make a database at a particular Git revision. Here’s a sample command:
~/sti/bin/macosx/und create -db gitahead_$commit.und \
                     -refdb gitahead.und -gitcommit $commit
I can use a shell script with a list of commits to generate all my databases. The problem comes from the compile_commands.json file. I know from creating the initial database that I’ll get much more accurate parses with a compile_commands.json created at the time point. But, checking out every commit to create a compile_commands.json file for it is likely overkill.
So, this step still required babysitting. In the end, my script paused after each analysis to give me a chance to record analysis errors and warnings in the spreadsheet. If the errors rose significantly, then I stopped the script and created a compile_commands.json file at the given revision.
Results
Since the counts are in my spreadsheet, I can use Microsoft Excel to generate my first trendline!

A few notes on this trendline. If you follow the exact steps here, you’ll notice that Microsoft Excel doesn’t interpret the date from the git log output as a date. Here’s the formula I used to convert the date where D is the column with the git log date:
= DATEVALUE(TEXTJOIN("-",FALSE,MID(D2,9,FIND(" ",D2,9)-9),MID(D2,5,3),MID(D2,10+FIND(" ",D2,9),4)))A second item worth noticing is the spikes. Plotting the data by date loses information about which branch the commit was on when it was created. For a detailed consideration of non-linear file history, try this article. In this case, it’s sufficient to know that commits adjacent in time might not be adjacent in Git and that results in spikes in the graph. This is discussed in more detail in this follow-up article.


