Abstract: Part 3 of a 5 article series about using Understand to analyze how a CMake-based project has changed over time. This article focuses on creating a CodeCheck Violation trend line from multiple databases representing different time points in GitAhead.
Suppose I have a lot of databases representing different time points in my project and I want to know how my project has improved (or worsened) over time. I’m going to track CodeCheck violations as that metrics. First, I need the databases, but luckily I’ve already created them in part 2.
Data Selection
Now I have about two hundred databases and I want to see CodeCheck trends. The first thing I need to decide is what kind of numbers I want at each time point. Ideally, I’ll have a few summary numbers for each database that I can plot over time, similar to the analysis errors and warnings in the previous article. I’ll pick violation counts by check type. So, ideally, for each database, I’d have some numbers like this:
- Check1: 200 violations
- Check2: 6 violations
- Check3: 0 violations
- Check4: 500,020 violations
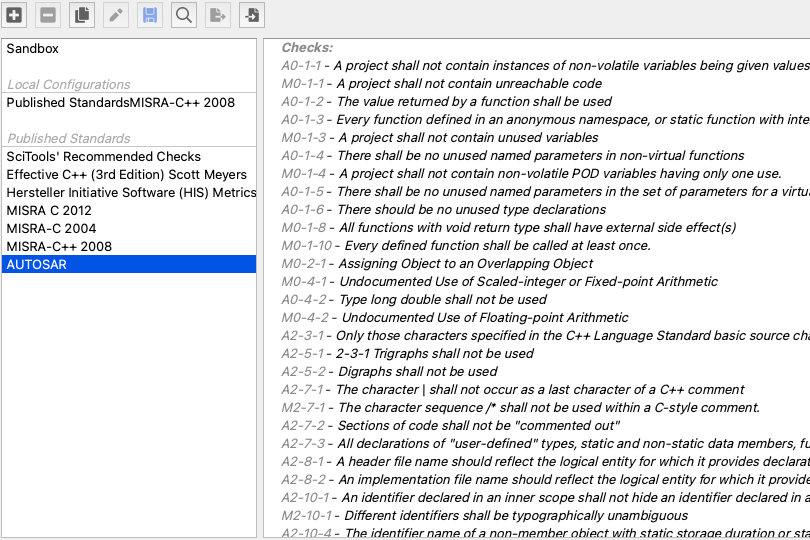
Which checks should I use? To save myself some thinking time, I’ll go with SciTool’s Recommended Checks. I can run the checks from the command line with this command:
und codecheck "SciTools' Recommended Checks" outputdir db.undTime & Space Requirements
Running this on one of the databases took about 125 seconds and produced the following three files:
total 26368
-rw-r--r--  1 natasha  staff   2.7M Jan 19 14:35 CodeCheckResultByFile.txt
-rw-r--r--  1 natasha  staff   8.2M Jan 19 14:35 CodeCheckResultByTable.csv
-rw-r--r--  1 natasha  staff   2.0M Jan 19 14:35 CodeCheckResultByViolation.txt
So, running CodeCheck on around 200 databases will take nearly 7 hours (125*200/3600) and produce about 2.6 GB of data (13*200/1000). It’s probably worth getting my scripts right before launching them.
Summarizing CodeCheck
Of the three code check files, the two text files have a tree-like structure that would be hard to get summary metrics from. Instead, I’ll focus on the csv file. The first two rows are:
| File | Violation | Line | Column | Entity | Kind | CheckID | Check Name |
| dep/cmark/cmark /src/blocks.c | Upper limit root was modified in the while loop. | 484 | 36 | cmark_parser::root | Public Object | RECOMMENDED_17 | SciTools’ Recommended Checks\Upper limit shall not be modified within the bounds of the loop |
I want aggregated statistics by CheckID which is the 7th column (1 based counting). I’m not an expert with awk by any means, but this is a relatively common task. So, with a bit of effort and the assumption that I’m running SciTool’s Recommended Checks, this awk script prints summary values in a comma-separated list for the checks from 0 to 17.
awk -F "\",\"" '
  {a[$7]++;}
  END {
    for(i=0; i <=17; i++) {
      k = sprintf("RECOMMENDED_%02d",i);
      f = f "," (k in a ? a[k] : 0);
    }
    print f;
  }'
Batch Processing
I can run CodeCheck and this awk script for every database and concatenate the results into a table for Microsoft Excel. But, 7 hours is a long time to wait. Is there anything that can be done to shorten the time?
It turns out that CodeCheck is not threaded because the checks are written in Perl or Python and neither language has great threading support. So, my script is only going to be taking 1 CPU and I’m pretty sure I have at least 8. So, I’ll break my list into chunks of about 25 commits and run each script at the same time from different terminals.
For this to work, I need to avoid overwriting the same results directory and summary csv. I might also want to keep a record of the CodeCheck log since my first database had a bunch of missing file errors to be aware of. Finally, I’ll keep the table file so I don’t have to wait 7 hours if I want to get different CodeCheck information. Here’s an example of the scripts I used:
#!/usr/bin/env bash

aggfilename="8efe4d6"
commits="8efe4d6 0cfa2f6";

echo "commit,RECOMMENDED_00,RECOMMENDED_01,RECOMMENDED_02,RECOMMENDED_03,RECOMMENDED_04,RECOMMENDED_05,RECOMMENDED_06,RECOMMENDED_07,RECOMMENDED_08,RECOMMENDED_09,RECOMMENDED_10,RECOMMENDED_11,RECOMMENDED_12,RECOMMENDED_13,RECOMMENDED_14,RECOMMENDED_15,RECOMMENDED_16,RECOMMENDED_17" > CodeCheckResults/agg_$aggfilename.csv

mkdir -p tmpresults_$aggfilename

for commit in $commits; do
  echo $commit
  ~/sti/bin/macosx/und codecheck "SciTools' Recommended Checks" tmpresults_$aggfilename gitahead_$commit.und &> CodeCheckResults/$commit.log
  cp tmpresults_$aggfilename/CodeCheckResultByTable.csv CodeCheckResults/table_$commit.csv

  echo -n "$commit" >> CodeCheckResults/agg_$aggfilename.csv
  awk -F "\",\"" '
    {a[$7]++;}
    END {
      for(i=0; i <=17; i++) {
        k = sprintf("RECOMMENDED_%02d",i);
        f = f "," (k in a ? a[k] : 0);
      }
      print f;
    }' tmpresults_$aggfilename/CodeCheckResultByTable.csv >> CodeCheckResults/agg_$aggfilename.csv
done
Combining the tables into my existing spreadsheet by matching commit numbers, I now have columns describing the time point, the analysis, and CodeChecks. I’ve already converted the git log date into an excel date (see the prior article) so I can directly plot the violations.
Plotting Results
My next problem is the scale. The “Variables Shall Be Commented” check (#16) has almost 20,000 violations compared to the Unused Static Globals check (#15) which has 1 violation. If I plot all my checks together, I won’t be able to see any changes.
Looking at the ranges, I’ll break the checks into 4 groups: 0-100; 100-1,000; 1,000-10,000; and 10,000+. Here they are:
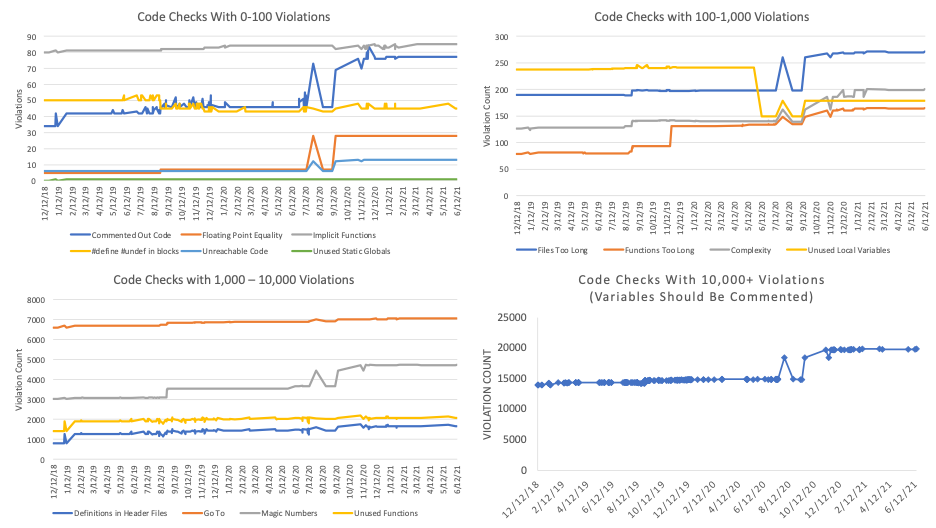
Since this is an after-the-fact analysis of commits that never intended to follow SciTool’s Recommended Checks, it’s not surprising the violations tended to increase as the size of the code base increased. It’s still interesting to note the outliers, though. Both “Unused Local Variables” (#14) and “#define #undef in blocks” (#07) actually decreased over time.
Parse Accuracy and Violations
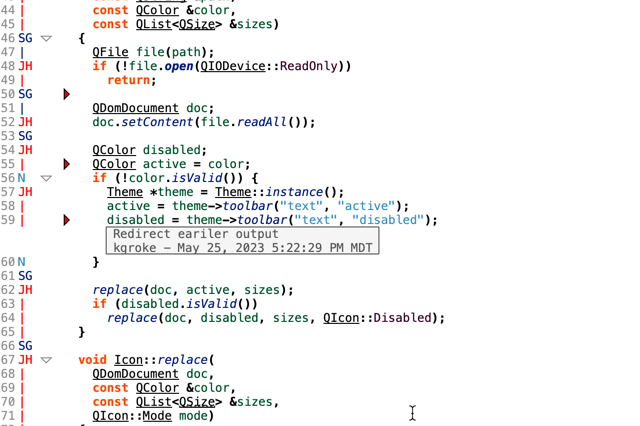
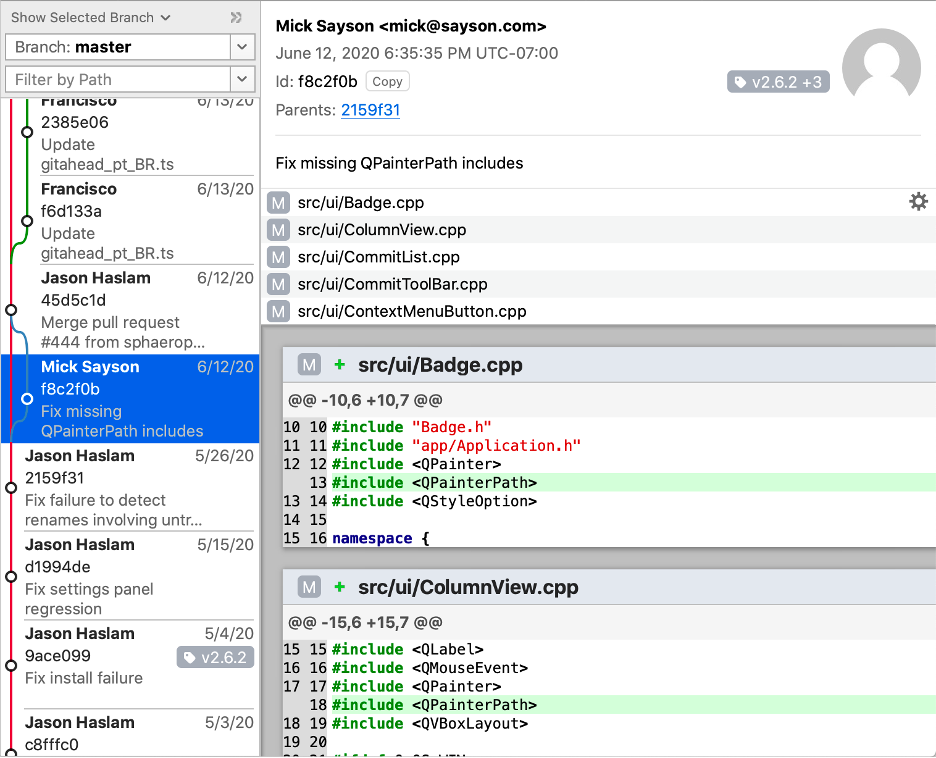
What caused the sharp drop in “Unused Local Variables” around June 2020? The drop corresponds to the following commit fixing QPainterPath includes. This is the same point where analysis errors dropped from 50 to 13 and the files parsed without any errors increased from 298 to 309. The 98 violations that were removed were probably related to QPainterPath local variables. It’s a good reminder that parse accuracy impacts CodeCheck.
Non-Linear History
Why is there a spike around August 2020 in most of the violation trends? As pointed out in the article generating the databases, Git histories are not necessarily linear. The spike around August 2020 is a specific example of that.
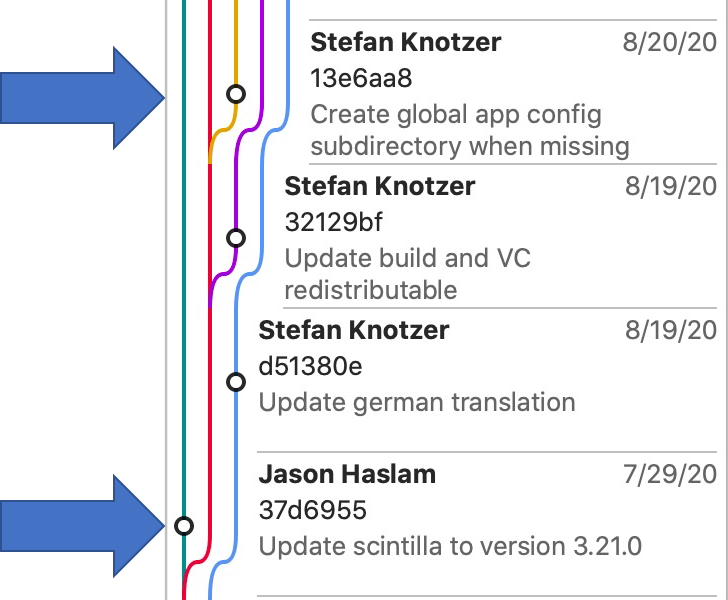
- A Scintilla update on the main branch changed a lot of files. A new compile_commands.json was created for the timepoint and the number of files in the project increased. That caused a sudden increase in violations.
- However, the next chronological time point (8/20/20) had branched from main before the changes so it still used a previous compile_commands.json that had fewer files. This caused the sudden decrease.
- Later commits branch after the Scintilla update, restoring the larger number of violations.
In part 4 we’ll look at normalizing these spikes to keep our trends meaninful.