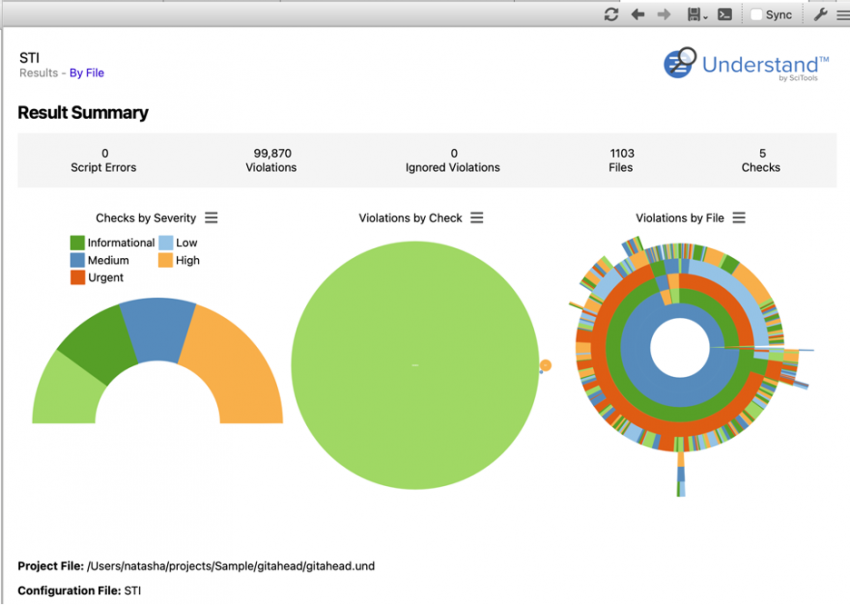
Abstract: Understand 7.0 allows you to create custom charts with plugins like those on our Welcome Page.
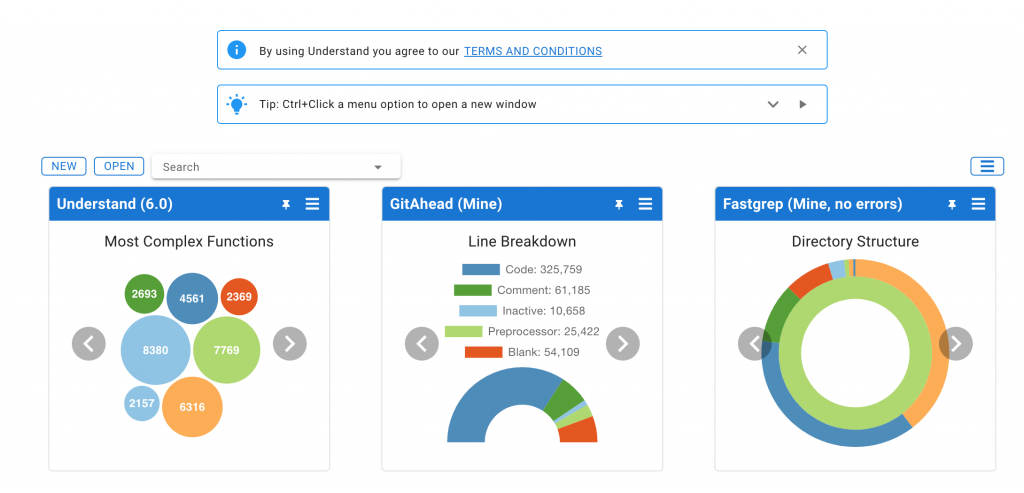
How do you feel about the charts on the welcome page? They’re pretty and surprisingly informative. But they’re not customizable, and worse, they’re web. I learned programming with C++ and trying to write web code is frustrating for me. If I’m missing a closing tag, just tell me. Don’t mostly work and then fail somewhere else.
Chart Layouts
So, suppose I want to customize one of the charts. Maybe I want my sunburst chart to be for Total Lines instead of Lines of Code, or I want my cyclomatic chart based on the modified cyclomatic complexity.
As someone who avoids web code whenever possible, step one is to reproduce the layout algorithms in C++. It was a long and arduous path with many obstacles … actually, it was pretty fun. But moving on past boring implementation details, there are new layout algorithms available to graph plugins. You can learn more about them here.
Customizing the Sunburst Chart
Now plugin developers can customize the charts to their hearts content. There are even demos for the welcome page charts. Let’s modify one to try the first customization above.
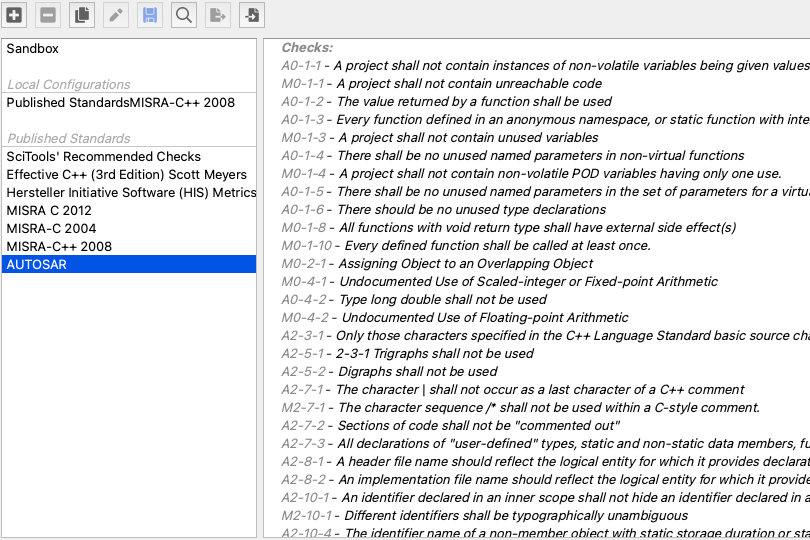
First, open the new Plugin Manager from the Tools menu. That’s right, our entire plugin library is now included with Understand and you can browse it with an all new GUI interface from inside Understand.
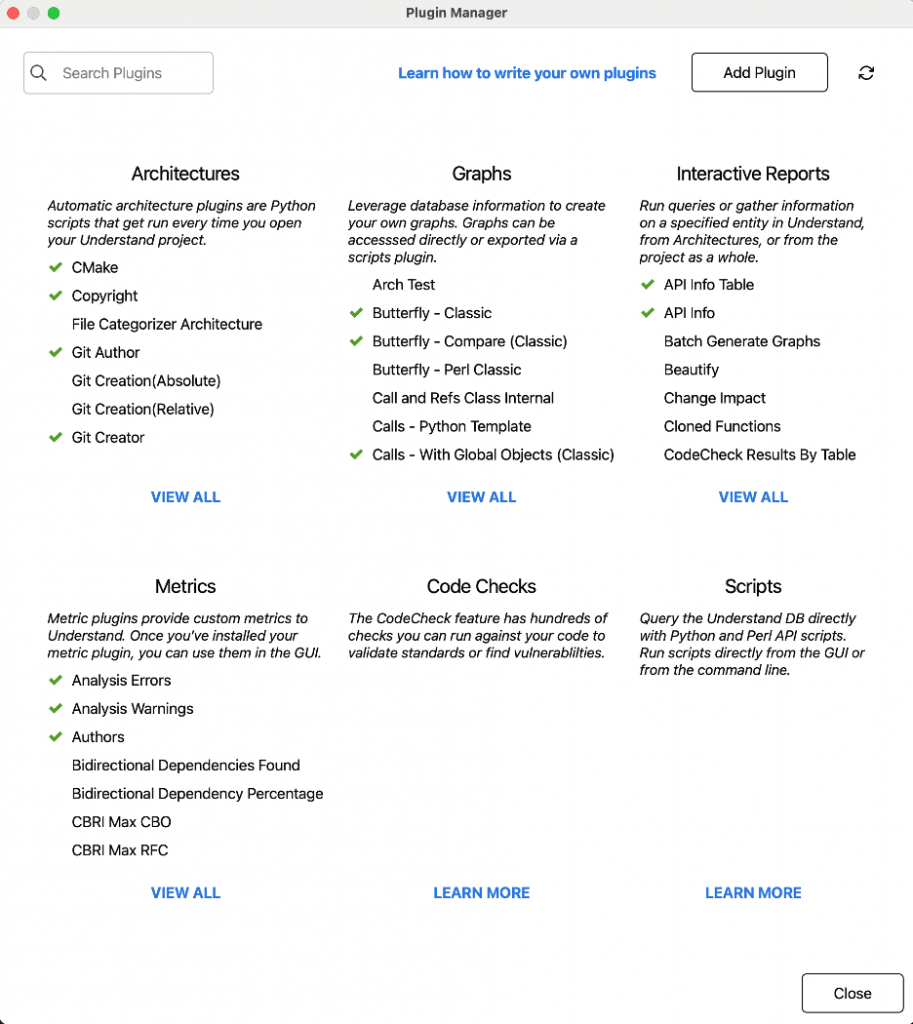
From the main page, go to View All Graphs and select “Sunburst By Lines of Code”. There’s a beautiful AI generated description of the plugin and an option to Customize.
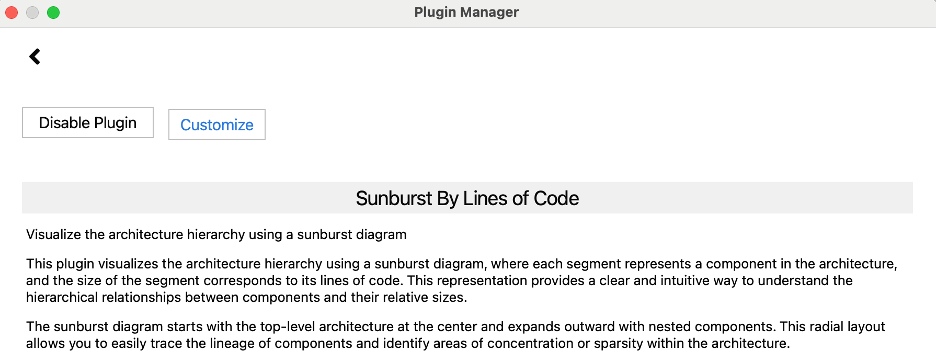
Customize will create a copy of the script in memory that you can edit. The file path is pre-populated to the correct directory for Understand to find it, but it’s not saved yet, so the title will have a strike-through.
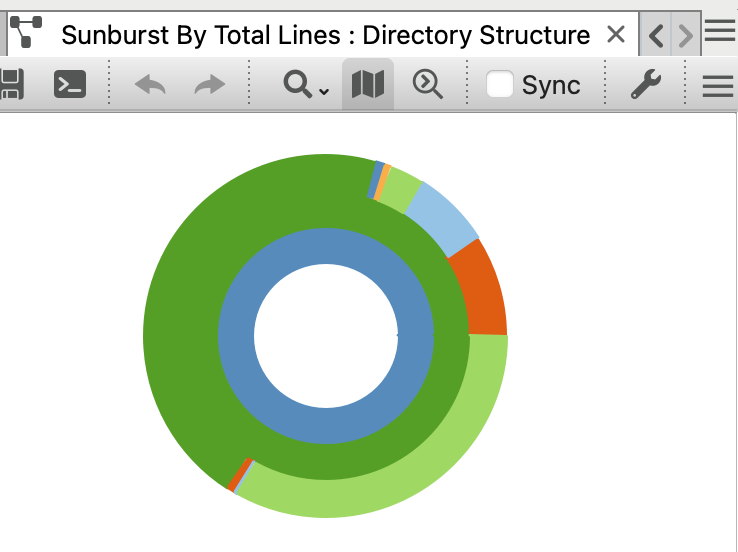
First off, I’ll make sure to change the name. If the name clashes with the existing plugin, it’s undefined which plugin is actually drawn. So, I’ll change the title to “Sunburst By Total Lines” and change line 44 to use the “CountLine” Metric and save the file to its default location.
There’s one tricky thing with plugin development. To save time for the vast majority of users who aren’t modifying plugin files, plugins are cached. My new plugin won’t show up until I force a refresh, which is accessed from the main page of the plugin Manager in the top right. The plugin will probably also need to be enabled.
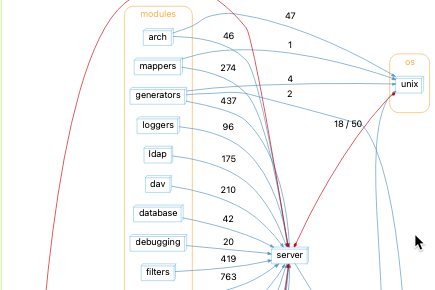
Now I can access my modified sunburst chart in the right click menu of any architecture. To match the Welcome Page, I’ll use Directory Structure. But I could visualize custom architectures too.
Treemaps
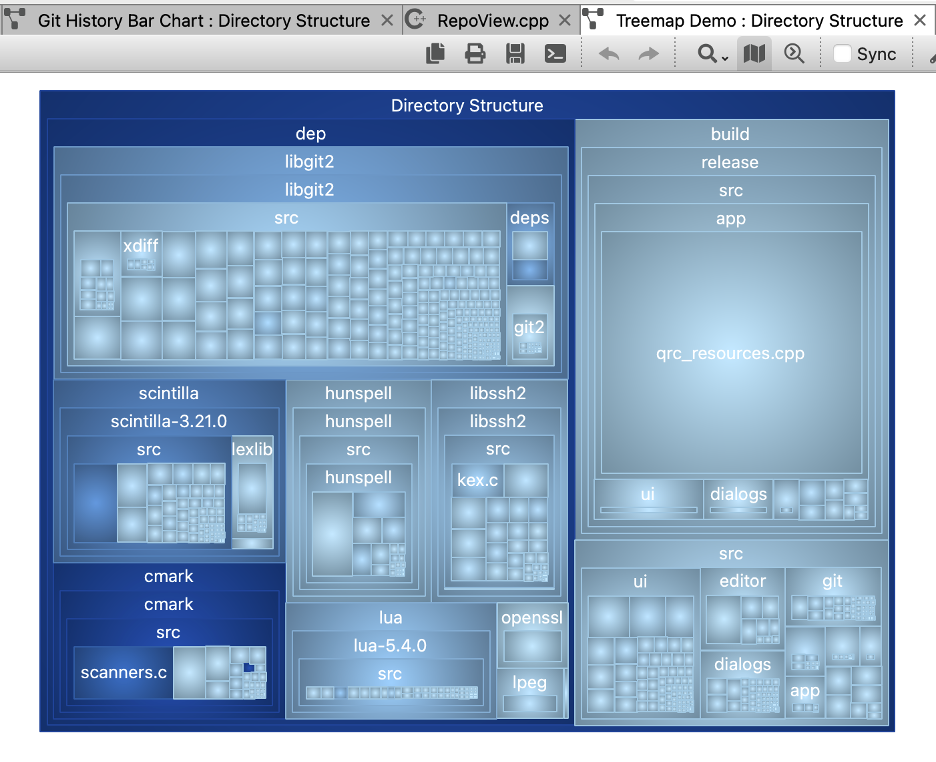
Occasionally, we get requests to modify our built-in treemaps. While I was adding welcome page layouts anyway, I went ahead and added a treemap layout as well.
It’s not exactly the same as the built-in treemap because it won’t resize to fit the screen. The size defaults to 640 wide and 480 high and can be changed by the user. That means that if you want to export a treemap from the API bigger than our built-in ones, you can do it by modifying the plugin!
Want to change the entity names from short to long? You can modify the plugin!
To allow the plugin to match the built in graph as closely as possible, I even added gradient support to rendering plugins. Amazing, right!
Have any cool charts? Share ideas or contributions from our public plugin repository!