Abstract: A script to calculate and display design structure matrices based on file dependencies—plus lots of cool metrics based on the matrix.
If I make a change to a file, how many other files might be affected? How hard is it to make a change to a particular code base? How do these values change across time or across code bases?
The research paper “Hidden Structure: Using Network Methods to Map Product Architecture” provides some metrics to answer these types of questions. This article describes the metrics in the research paper and how to calculate them using Understand’s Python API. You can download the complete script from our plugin repository.
If I make a change to a file, how many other files might be affected?
Direct Dependencies
Suppose I have a file called foo. If I change foo, then any file that depends on foo might need to be changed, too. The number of files that depend on foo is the direct fan in (DFI) value. In the other direction, the number of files foo depends on is the direct fan out (DFO). The direct fan metrics are one answer to how many files might need to change if file foo is changed.
Dependencies in Understand
How can I find file dependencies? The research paper uses call trees. So file1 depends on file2 if a function defined in file1 calls a function defined in file2. To find this out with Understand, you could do something like this:
import understand
import sys

db = understand.open(sys.argv[1])
file = db.lookup(sys.argv[2], "file")[0]
depOnFiles = set()
for callref in file.filerefs("call", unique=True):
  for defref in callref.ent().refs("definein"):
    depOnFiles.add(defref.file())
print (len(depOnFiles))
But this is the long way around. Finding dependencies is common enough that it’s built in. However, Understand uses more than just calls to calculate dependencies. The full details on how dependencies are calculated are in this article.
The main detail to be aware of is that Understand has two dependency modes: link time and compile time. For that call example, suppose file1 calls foo() which is declared in file2.h and defined in file2.cpp. The link time dependency is from file1 to file2.cpp, where foo() is defined. The compile time dependency is from file1 to file2.h, where foo() is declared. Link time versus compile time is a project setting accessible from Project ->Configure Project ->Dependencies.
With Understand’s built-in functions, the DFO and DFI are (adding one to assume a self-dependency):
dfo = len(file.depends()) + 1
dfi = len(file.dependsby()) + 1
Indirect Dependencies
What if dependencies propagate? So, if I change file1, not only do I have to change every file that depends on file1, but I also have to change every file that depends on a file that depends on file1, up the entire tree. The number of unique files in the fully expanded depends-on tree is the visible (reachable) fan out (VFO). The size of the reverse tree is the visible fan in (VFI). The research paper suggests that the VFO and VFI values are more predictive than the DFO and DFI.
Calculating Indirect Dependencies
So, for my script, I need to build the direct dependency matrix from Understand and then calculate the visibility matrix by calculating the transitive closure. I’ll assume that the dependency matrix is generally sparse. So, rather than store it as a full matrix, I store it as a dictionary, and I’ll calculate the visibility with a depth-first search rather than Warshall’s algorithm.
If you’re calculating a lot of dependencies with Understand, it’s important to know that calculating forward dependencies is a lot faster than calculating reverse dependencies. So, it’s fastest to build the graph using depends() and calculate fan in values with the final graph instead of using dependsby().
How hard is it to make a change to a particular code base?
So far the metrics have all been for specific files. But a project contains a lot of files. What kind of measures can I use for the entire project?
Propagation Cost
The paper defines the propagation cost as the density of the visibility matrix. This is calculated by summing the VFI (or VFO) of each file and dividing by the size of the matrix (the number of files squared).
For an example, let’s start looking at a real project. I’ll start with the FastGrep sample project because it’s small enough to display easily. The matrix (plus the identity matrix to assume each file is dependent on itself) is:
| timer.c | regexp.h | try.c | strpbrk.c | regsub.c | regmagic.h | regerror.c | regexp.c | egrep.c | |
| timer.c | Ident | Direct | Direct | Visible | Visible | Direct | |||
| regexp.h | Ident | ||||||||
| try.c | Direct | Ident | Direct | Visible | Visible | Direct | |||
| strpbrk.c | Ident | ||||||||
| regsub.c | Direct | Ident | Direct | Direct | |||||
| regmagic.h | Ident | ||||||||
| regerror.c | Ident | ||||||||
| regexp.c | Direct | Direct | Direct | Ident | |||||
| egrep.c | Direct | Direct | Visible | Visible | Direct | Ident |
And the metrics for each file are:
| files | DFI | DFO | VFI | VFO |
| egrep.c | 1 | 4 | 1 | 6 |
| regerror.c | 3 | 1 | 6 | 1 |
| regexp.c | 4 | 4 | 4 | 4 |
| regexp.h | 6 | 1 | 6 | 1 |
| regmagic.h | 3 | 1 | 6 | 1 |
| regsub.c | 3 | 4 | 3 | 4 |
| strpbrk.c | 2 | 1 | 2 | 1 |
| timer.c | 1 | 4 | 1 | 6 |
| try.c | 1 | 4 | 1 | 6 |
| Total | 24 | 24 | 30 | 30 |
Then the propagation cost is 30 / (9*9) = 0.37.
Core Size
Are there any other project metrics we can calculate? The authors tried plotting the VFI and VFO metrics as a scatter plot and found a pattern. For this, I’ll use the Apache sample project since FastGrep is too small to show it. Apache has 395 files with a propagation cost of 0.43. The visibility matrix with files sorted by file path is:
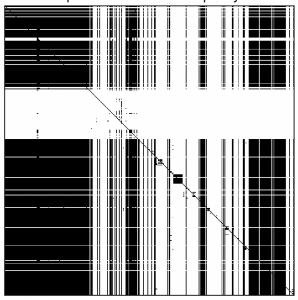
The scatter plot is:
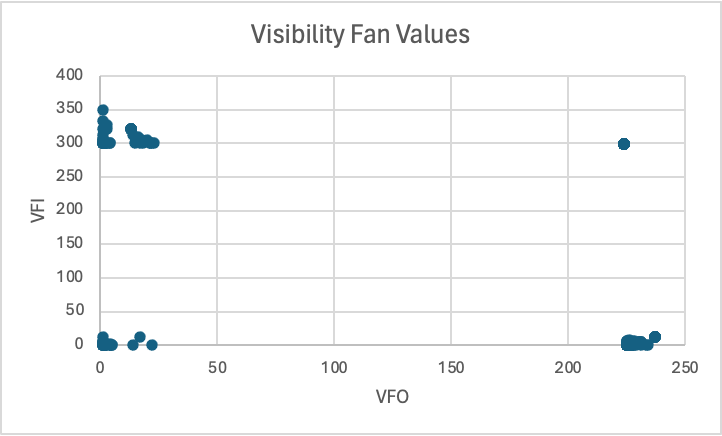
The authors noticed four distinct clusters. The point in the top right actually has 171 files in it, each with the same VFI and VFO fan out. This is a cyclical group, where every file is reachable from every other file. So, each file in the group has the same VFI and VFO values.
The largest cyclical group is referred to as the Core. The size of the Core is a project metric often expressed as a percentage. So, Apache’s core is 171 / 395 files = 43% of the project.
The research paper found cyclical groups using the VFI and VFO values and the matrix. The script uses Tarjan’s algorithm, the same as dependency rules in Understand, because it was easier for me to implement.
How do these values change across time or across code bases?
What happens when we start comparing projects? I’ll use the following six projects:
| Project | Files | Propagation | Core Percentage |
| Apache (Sample*) | 395 | 44% | 43% |
| Linux Kernel (Sample*) | 438 | 54% | 59% |
| GitAhead | 1096 | 18% | 23% |
| Gephi (Java) | 1324 | 1% | 3% |
| OpenSSL | 1700 | 45% | 48% |
| CMake | 1793 | 22% | 25% |
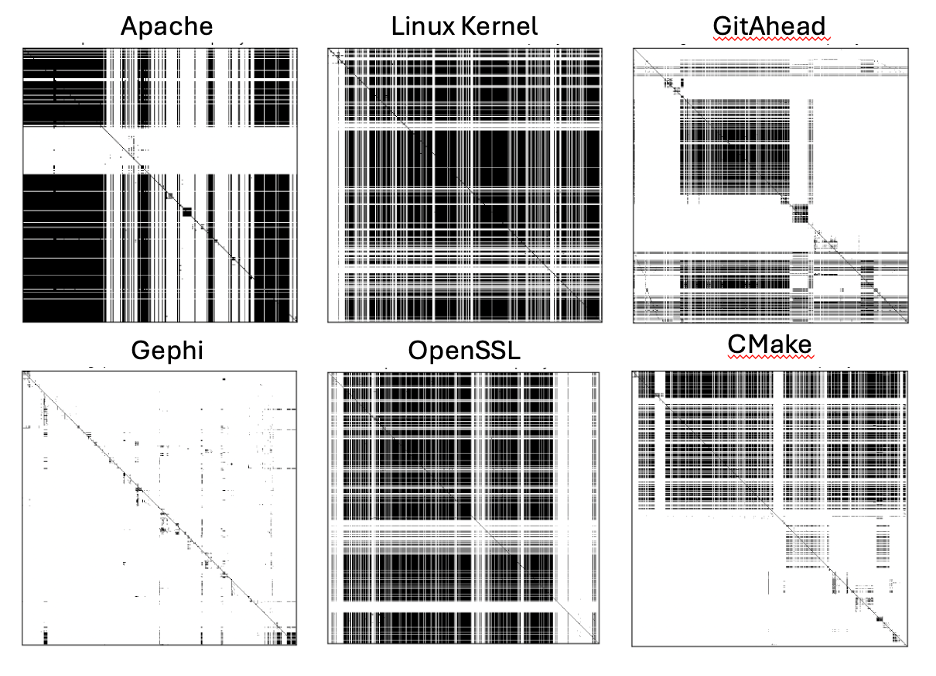
The matrices for the six projects are:
Matrix Sorting
From the matrices, the overall structure of the project isn’t very clear. For instance, I wouldn’t have guessed that GitAhead and CMake would have similar core sizes. So, the authors of the research paper sort the matrices by the four quadrants revealed in the scatter plot. The quadrants are:
- Shared Files (top left) which are used by many other files (high VFI) but don’t have many dependencies themselves (low VFO)
- Core files (top right) which are cyclical and have high VFI and high VFO.
- Periphery files (bottom left) which have low VFI and low VFO.
- Control files (bottom right) which use many other files (high VFO) but aren’t depended on by very many (low VFI).
Matrices are sorted first by quadrant, then by descending VFI and finally by ascending VFO. Now the matrices for the six projects are:
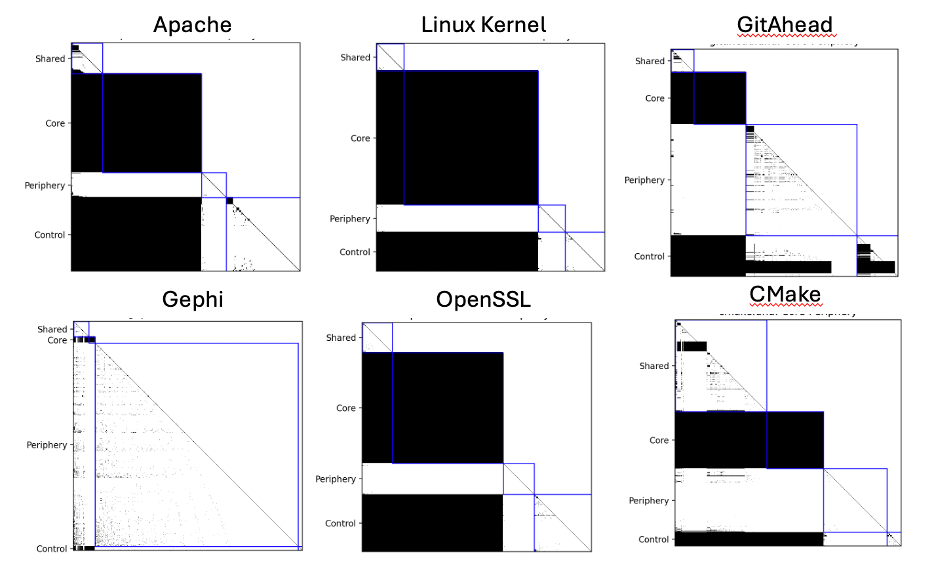
The similarities between projects are a lot more obvious now, as well as some differences. For example, GitAhead has a lot more periphery files than CMake and fewer shared files.
Architecture Types
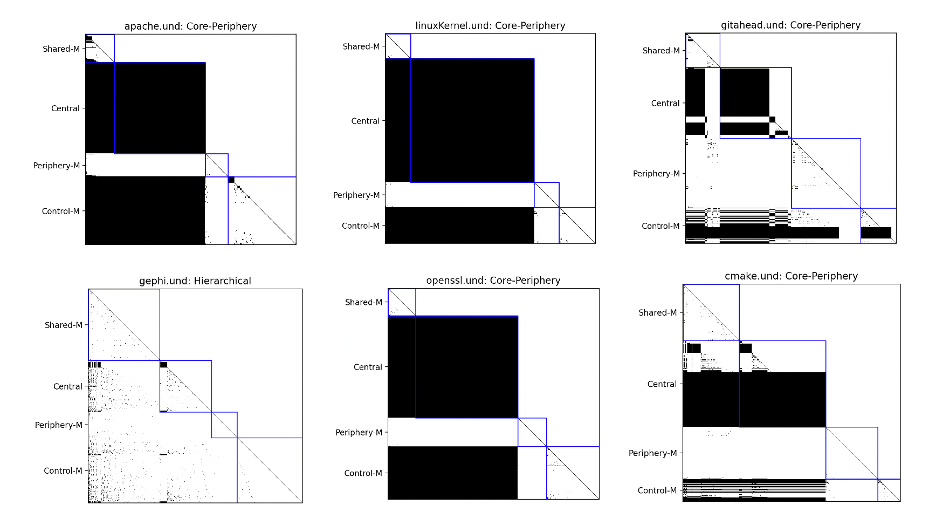
But, for Gephi, with a core percentage of only 3%, the groups don’t help very much. Practically everything is in one group. The research paper would categorize Gephi as a “Hierarchical” code base, whereas the other five projects are “Core-Periphery.” The four categories of projects identified in the paper are:
- Hierarchical: core percentage < 4%
- Multi-Core: core percentage >= 4% and core size < 1.5 * second largest cycle
- Borderline Core-Periphery: not hierarchical or multi-core and core percentage < 6%
- Core-Peripheray: not any of the above
For Hierarchical and Mulit-Core systems, instead of using the core’s VFI and VFO as cutoffs for the four quadrants, the median VFI and VFO are used. The matrices based on median values are:
Try it Yourself
Interested in how your code base looks? Try out the script. By default, the script calculates the visibility matrix, file metrics, project metrics and type, and displays the result using matplotlib. However, the python interpreter shipped with Understand (upython) doesn’t include matplotlib. So, to get the graphic, you’ll need to use your own python installation and set it up with Understand (see this article). You can pass the “–noshow” argument to the script to skip the matplotlib display. This allows the script to be run with upython. There are also arguments to save out the matrix and metrics to csv files, change the sorting, and override the core versus median strategy for classifying the files.
Our plugin repository includes lots of other cool scripts as well. Check it out.


