Abstract: learn about new ireport capabilities in Understand 7.0 including charts, tables, and new exports.
I like knowing which blog articles have the most views, especially if they happen to be ones I wrote. This means that every Monday I download statistics for the blog, run them through a script to pull out the values I’m interested in, update my excel spreadsheet, and compose an email summarizing my victory with charts and tables. I’ve done my best to automate the process with the script, but some steps I still have to perform manually.
Maybe you’ve found yourself in a similar situation with Understand. Like the blog statistics, Understand allows you to access raw data with the API and has some built-in reports. We even have interactive report plugins to let you filter the data down to just what you’re interested in. But if you wanted formatted output to send to someone else, you were likely still moving data into another program to get charts and tables.
New IReport Features
Understand 7.0 includes a large update to interactive reports to remove these pain points. Now interactive reports support tables, charts/graphs, exporting to html/pdf, and running from the command line. For a quick overview, let’s see how the “Git Authors” interactive report has changed.
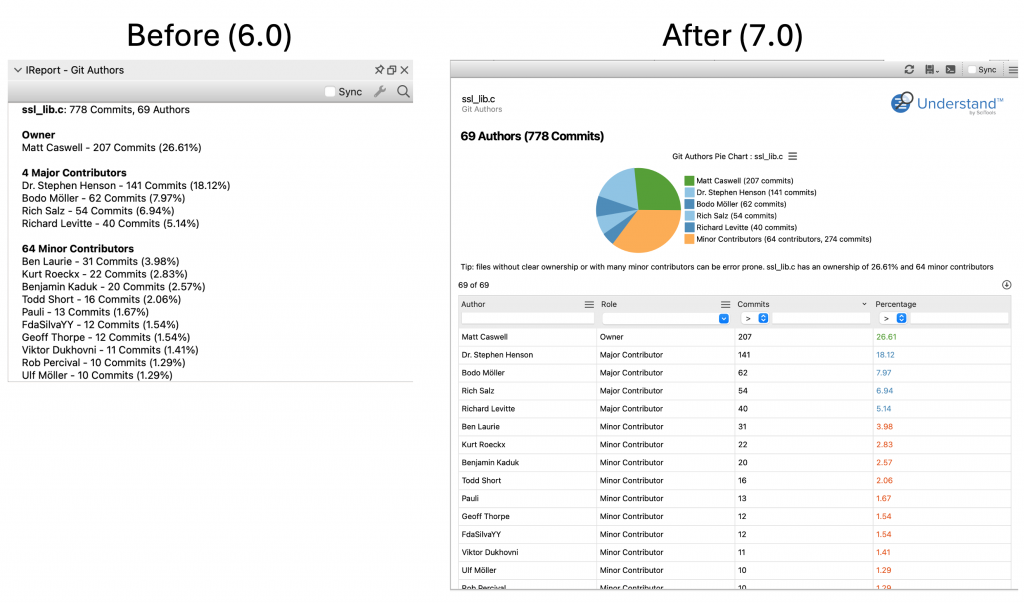
IReports now open in document windows instead of docked windows. Tables allow sorting, filtering, and quickly exporting to CSV with the download button on the right just above the table. There’s also a chart summarizing the information, and new heading support allows breaking the report down in sections.
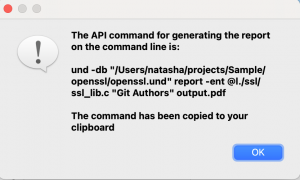
In the top toolbar, the save icon allows exporting to html or pdf. The next button over is the API command. Suppose I wanted to generate this report every week as part of a script. I can click on the API command button to copy the complete API command to the clipboard:
API Info
If you’re a script writer, your first reaction to these changes is probably horror. Sure, having the extra space of a document window looks prettier, but how are you supposed to write scripts in the editor window when “API Info” and “Tokenizer” keep taking over your editor screen.
I’m sorry, Kyle, but you’ll probably have to change your workflow. The least intrusive change is using released windows. From the hamburger menu in the toolbar, release the ireport window. Resize it down to the size of a dock window. Also, make sure the “Keep Released Windows Forward” option is set. You may also want to check the “sync” checkbox. Now API Info is visible for the selected entity/architecture in the same location it used to be and you can interact with the editor like normal. The other alternative is split workspaces to have two document areas.
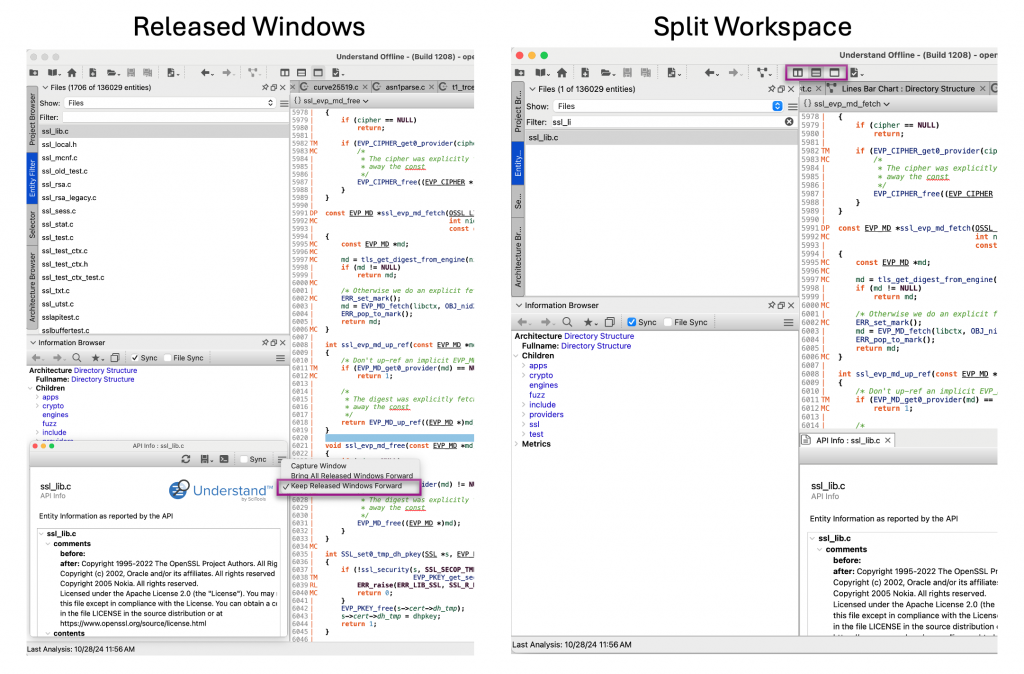
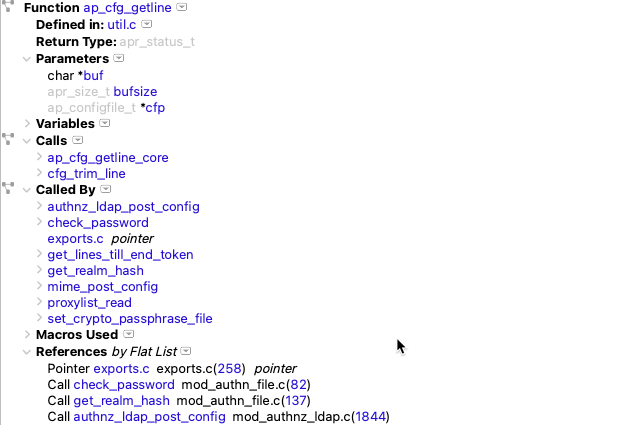
Finally, a small consolation. Yes, “API Info” as traditionally used is less convenient. But, the tasks script writers are using API info might now be easier. For instance, I’m almost always accessing “API Info” for the references list. I hate having to scroll to find the reference kind I’m interested in and having to expand the references to see the details. With the new table support, I can view all the information at once and quickly sort and filter:

More Cool Features
Ending the article with script writer complaints would be depressing. So let’s briefly look at two more cool features. First, CodeCheck inspections can be targets for interactive reports. So now “Results By Check” is now a full report that looks like this:
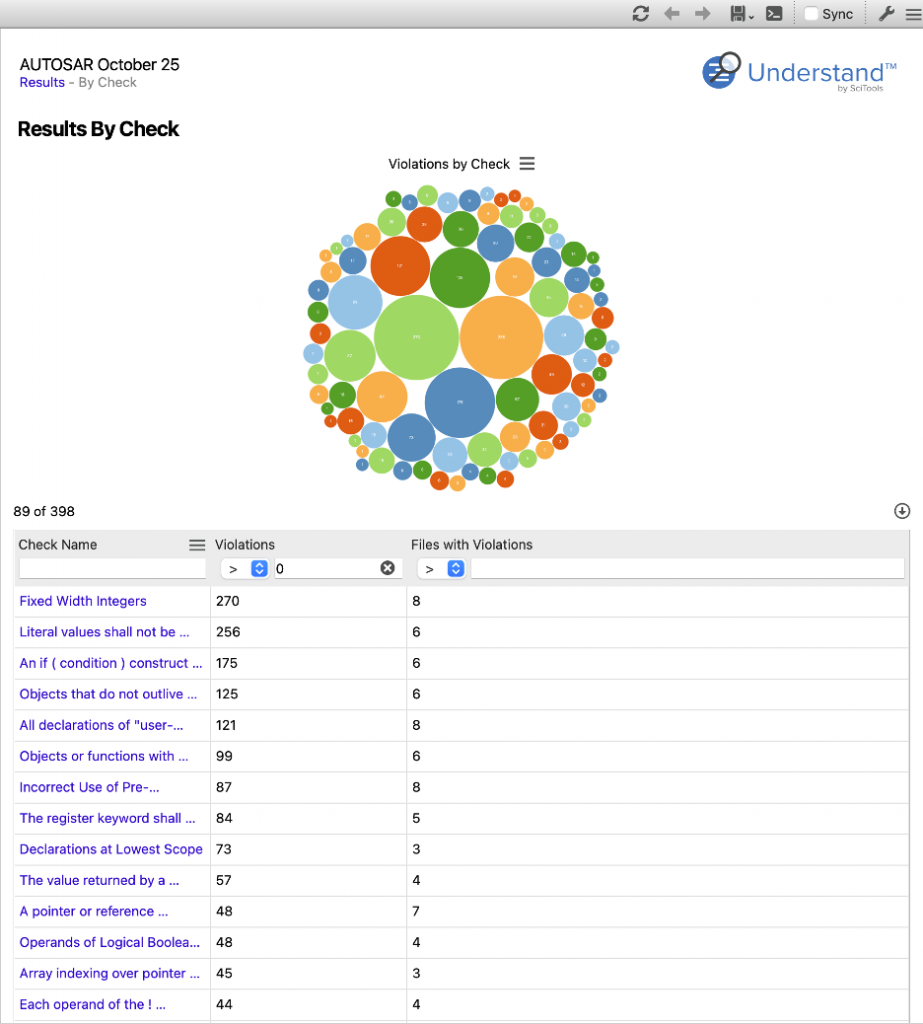
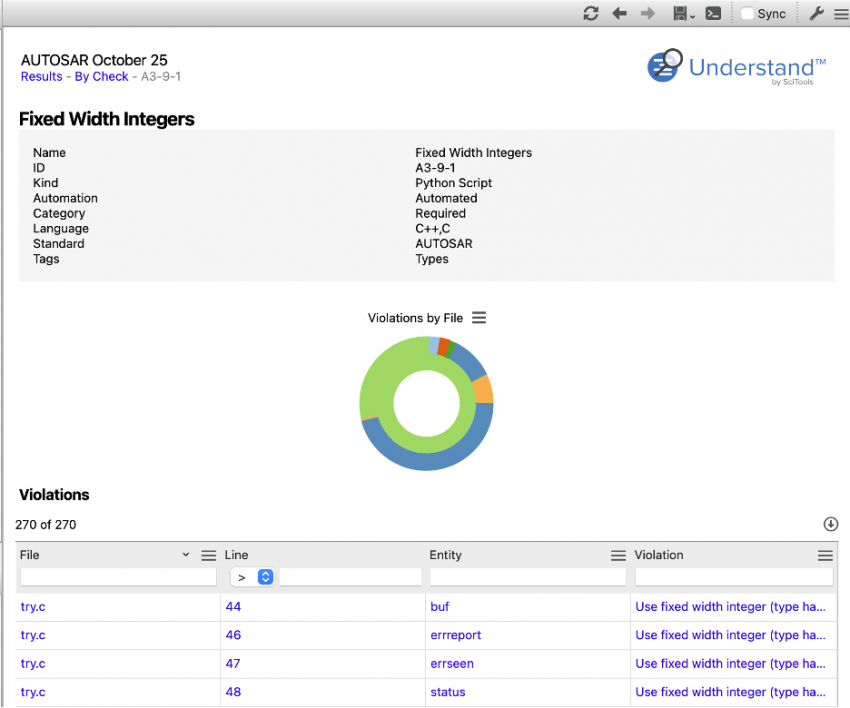
But wait. Now that it’s not a tree, how I can get the details? Fear not. The second cool feature is pages. An interactive report can now have multiple pages. You can choose to export only the current page or to export all pages. An html export with multiple pages will output multiple files, maintaining links. A pdf export will concatenate pages together, but still maintain links. So, from the first page, I can click on “Fixed Width Integers” to open a page for just that check:

I can use the history buttons in the toolbar, or the breadcrumbs in the report header to navigate back to other pages. And of course, CodeCheck reports can also be exported as html or pdf from the GUI or command line.
The updated IReports in Understand 7.0 offer significant improvements for generating and sharing code analysis reports. While the transition may require script writers to adjust their workflow slightly, the added functionality in IReports ultimately provides greater flexibility and efficiency in accessing and presenting critical code metrics. The ability to create comprehensive reports directly within Understand simplifies analysis and communication, enhancing productivity for all users.

