TL;DR: Use “Relationship” graphs, which draw sub-graphs between entities, to break big graphs into little graphs and work your way thru them by turning a big thorny graph into a few easy to follow graphs.
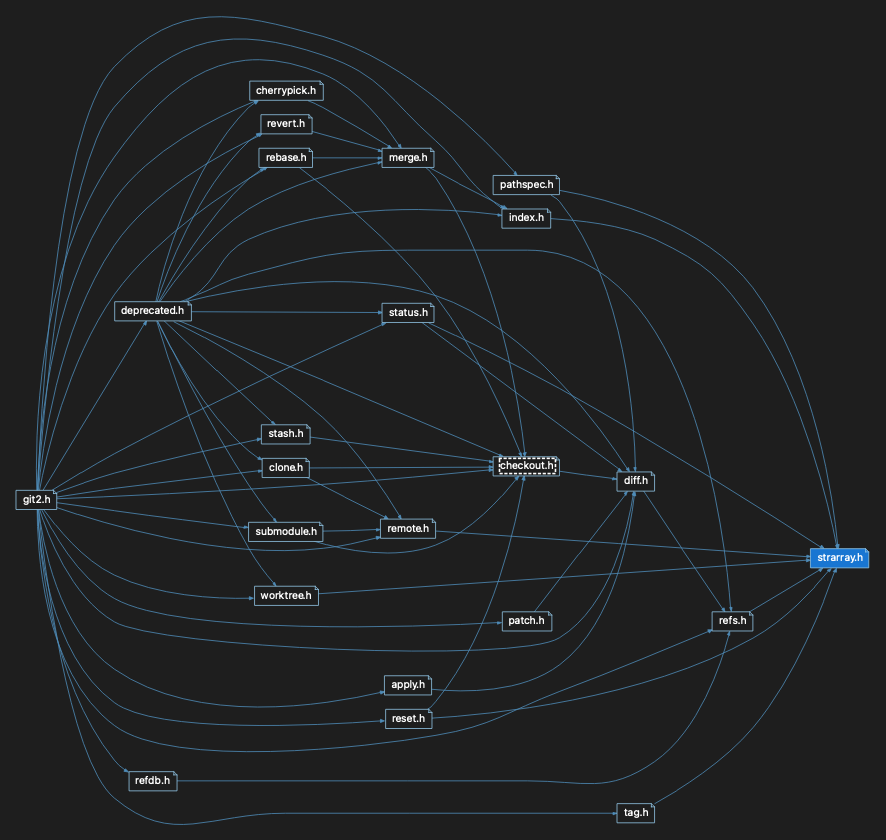
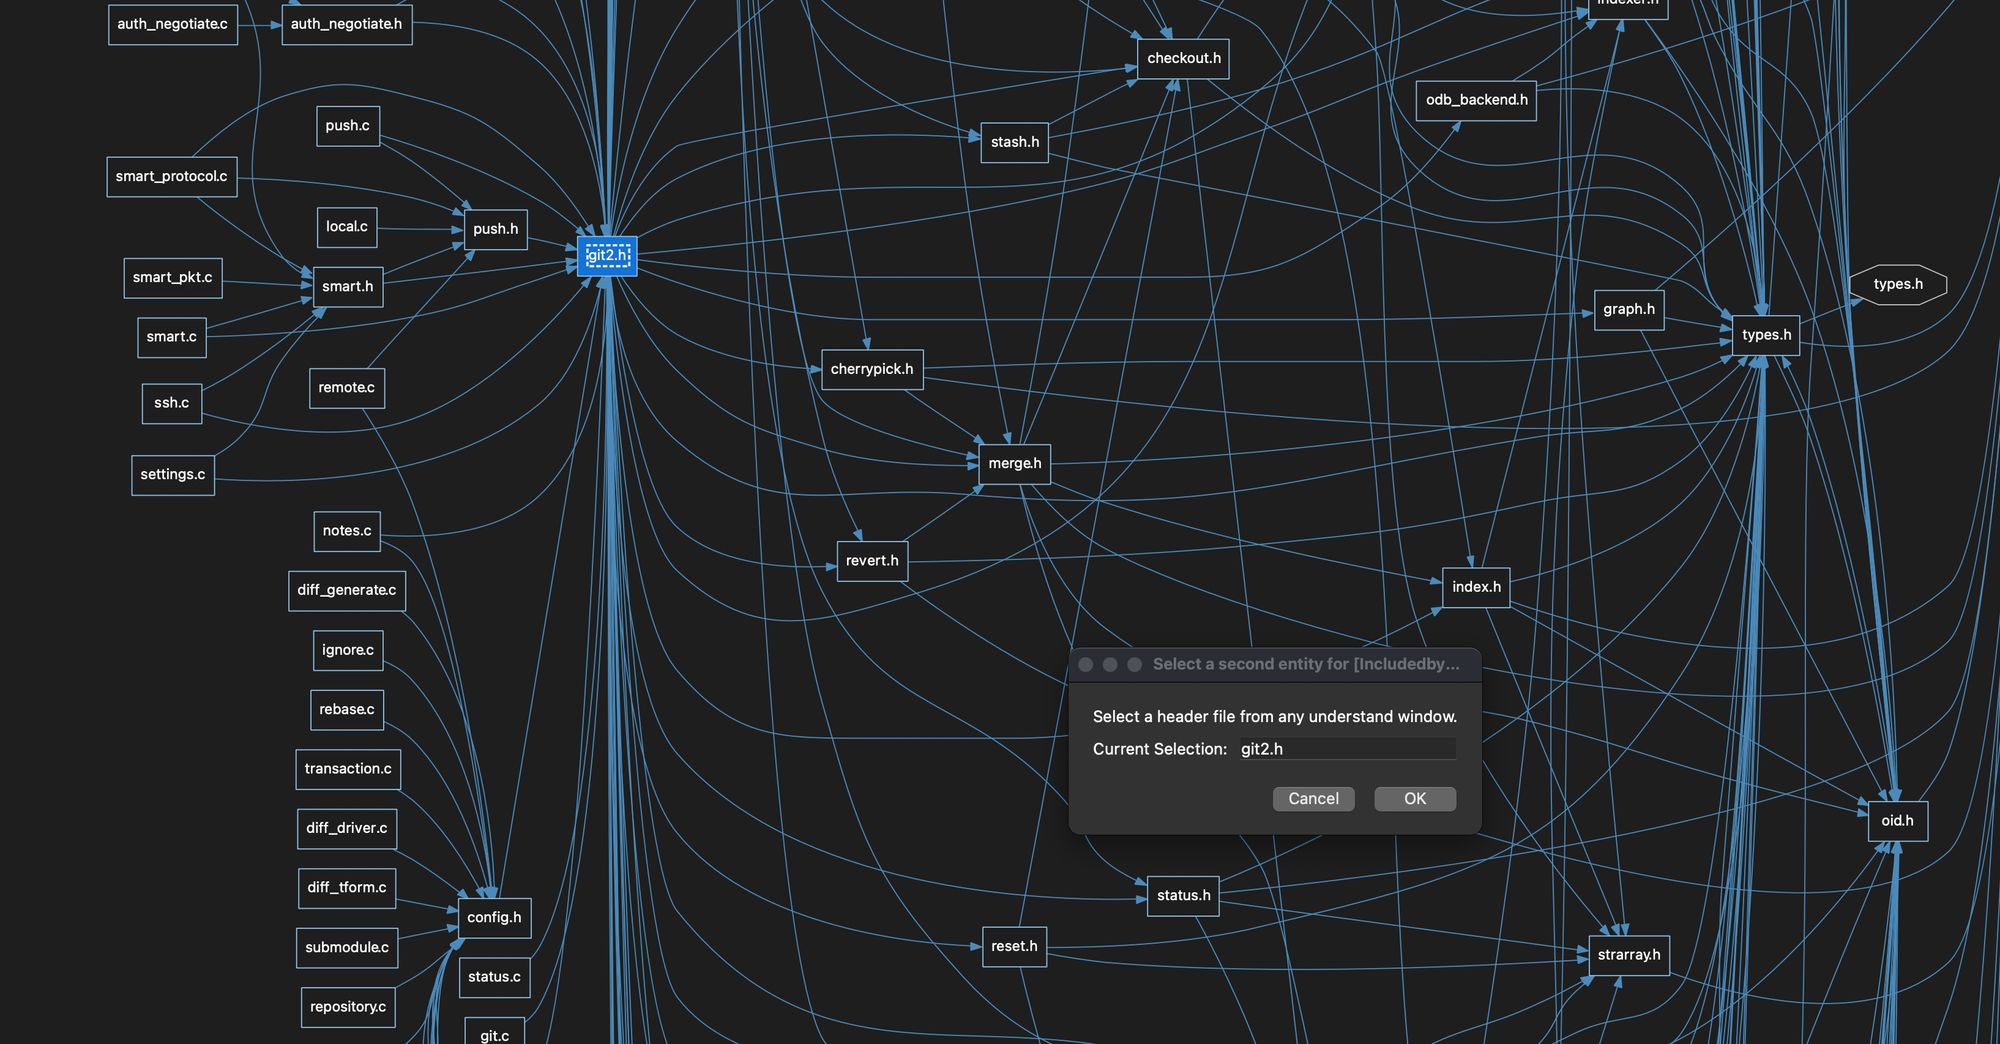
This is a big graph.
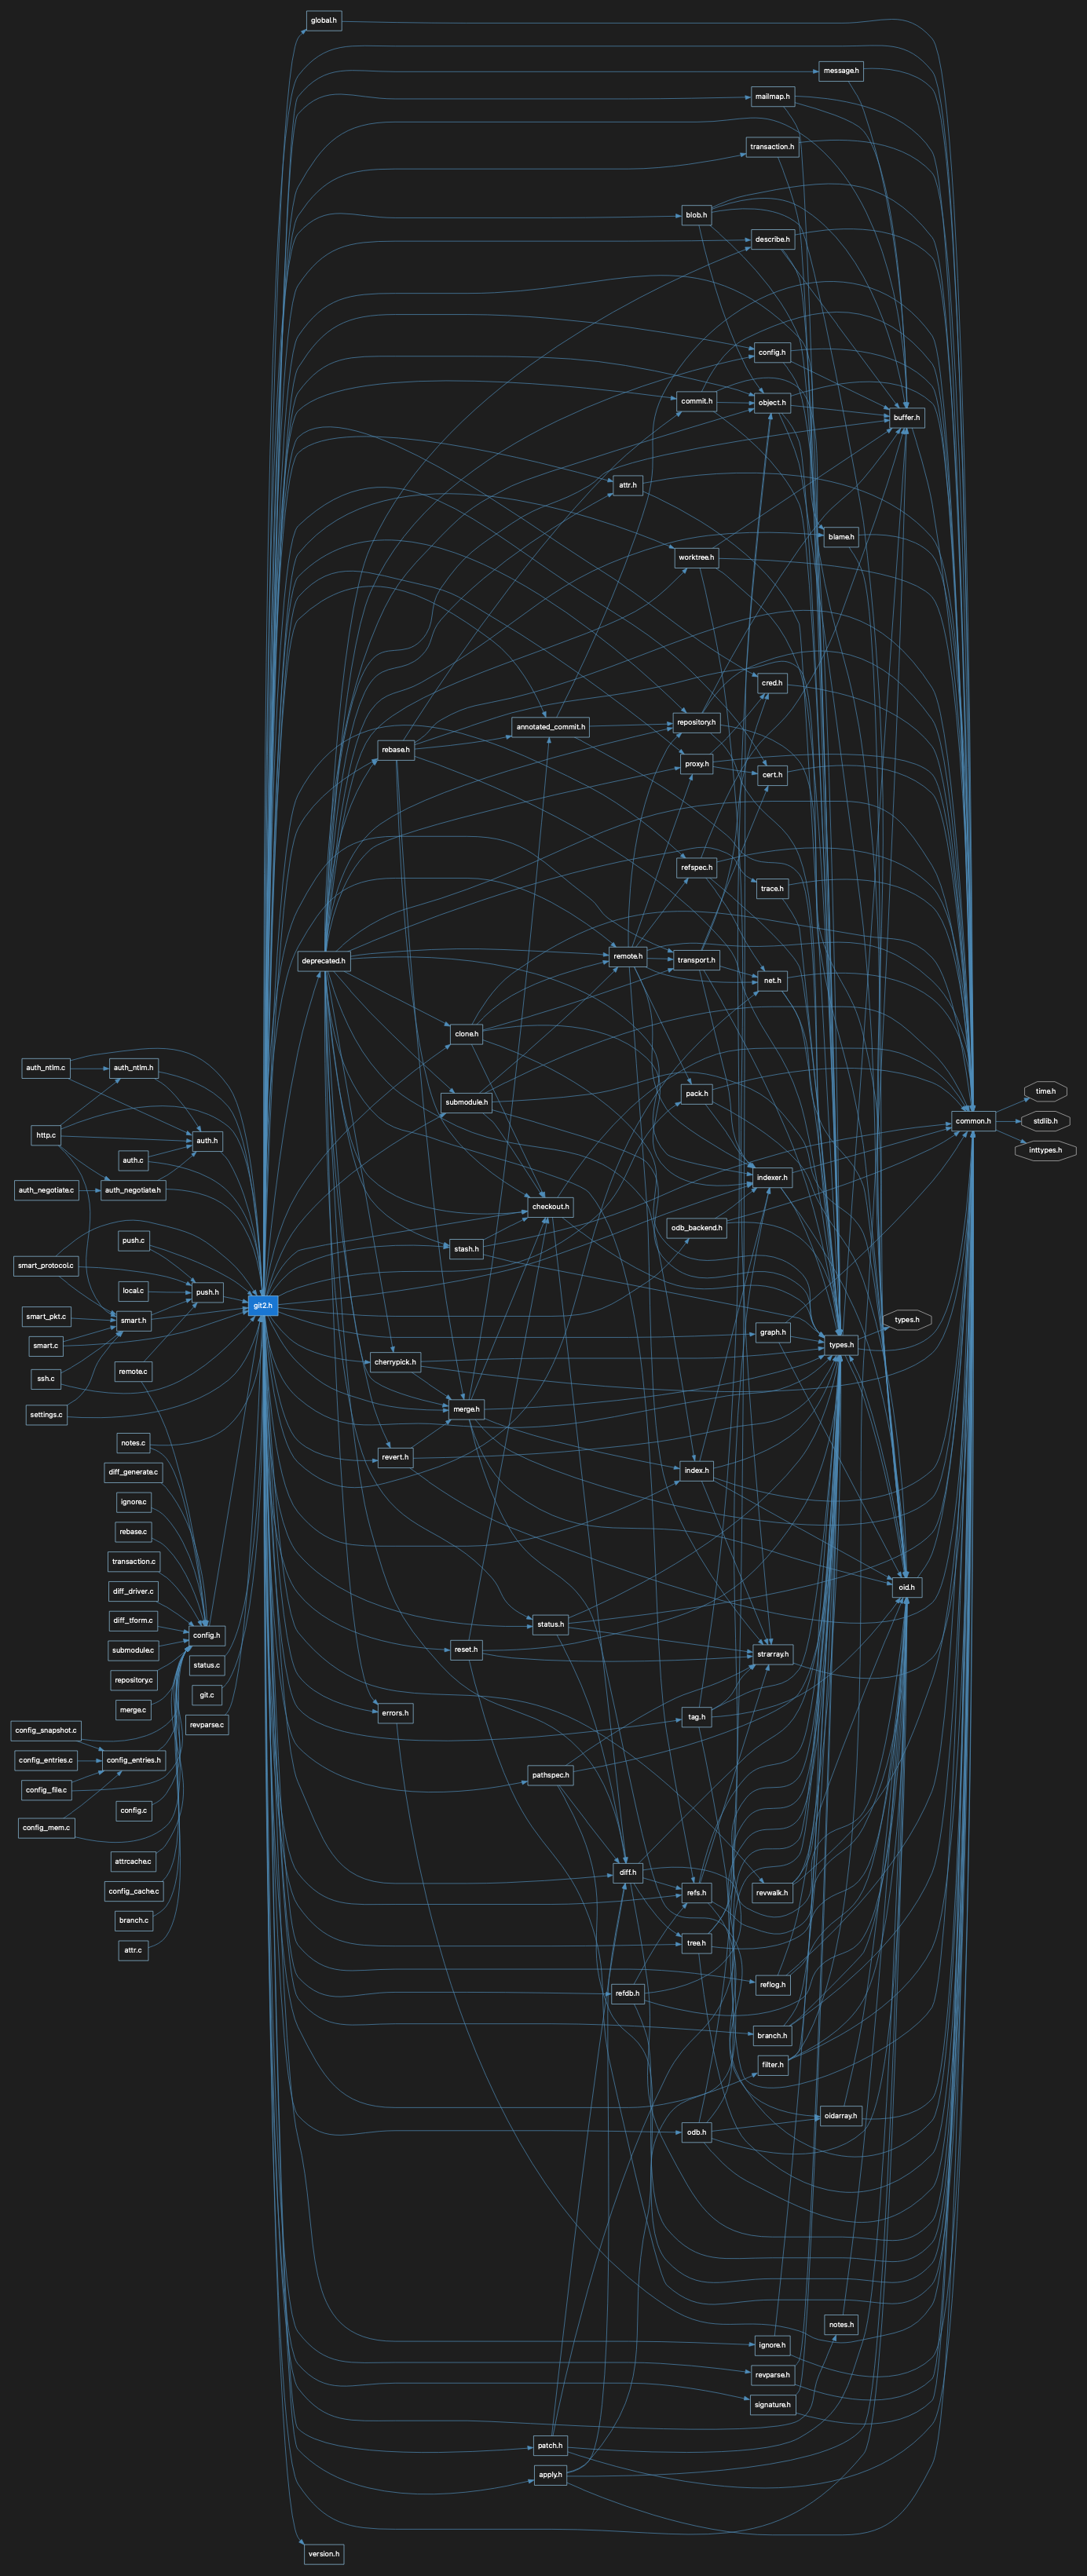
Not the biggest, or even that big, but when visual information shows more than 5 to 10 connected things the human brain hits the brakes and says “nope can’t handle it”.
Using relationship graphs we can show smaller sections of this large graph – either for visual simplicity or because we’ve narrowed down the issue we are tracking to being between two entities – either in a call, callby, include, includeby or other hierarchical relationship in your source code.
In this case, we are interested in a problem manifesting in the include tree of git2.h in the open-source project GitAhead (https://github.com/gitahead/gitahead) – an open-source project that SciTools maintains.
We’ve identified that the problem is happening between git2.h and strarray.com. However, if we use the include tree for git2.h, as shown above, it’s unwieldy and too complicated to keep track of where we are exploring.
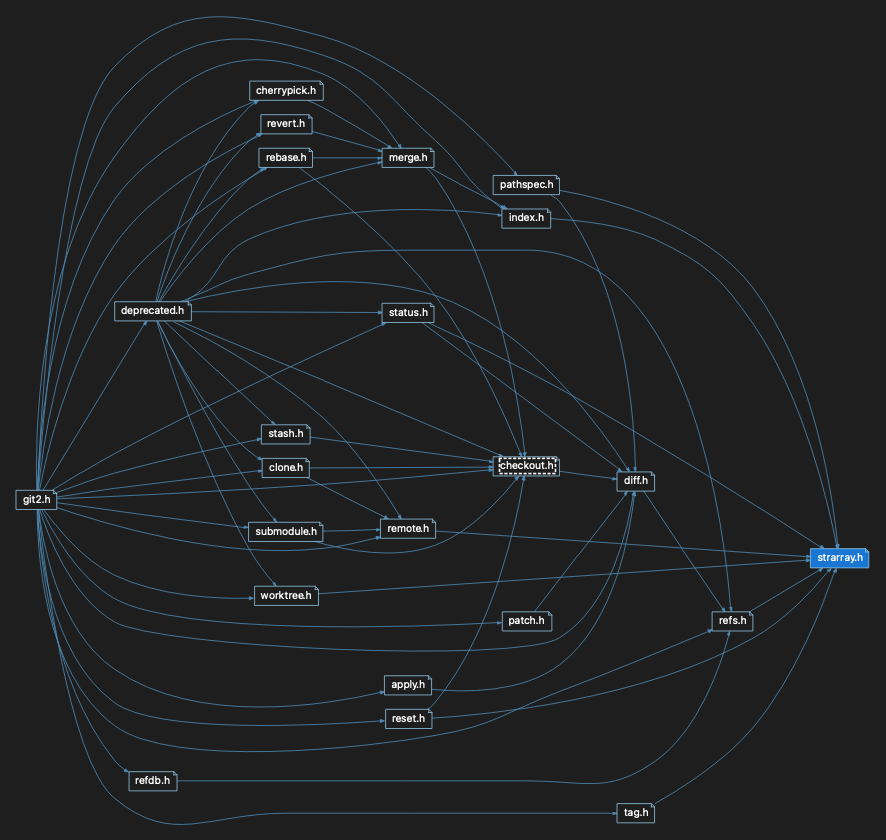
The “IncludeBy Relations” graph saves us by graphing just the paths between “strarray.h” and “git2.h” – greatly simplifying the graph.
To do this simply click on the graph node you want to build the sub-graph between and choose “Entity->Graph->Includeby Relations”:
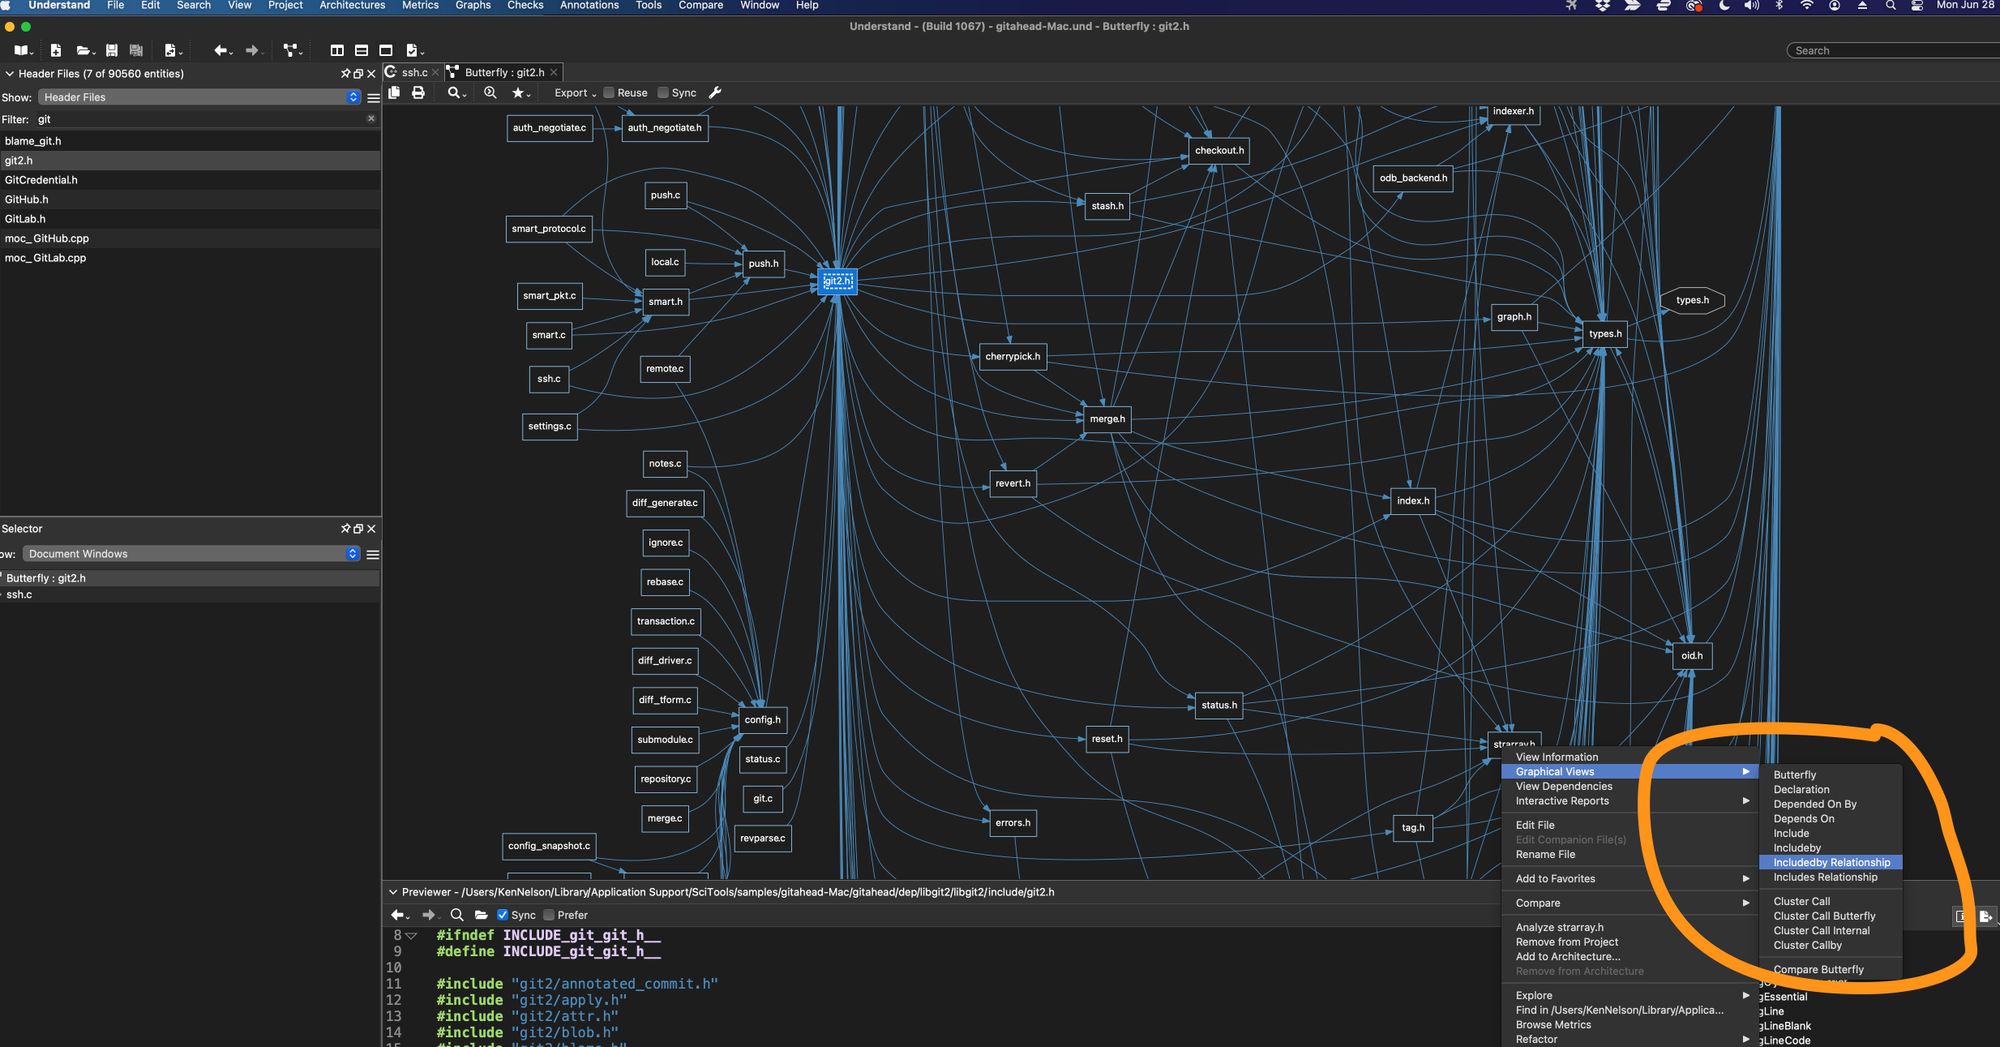
Then click on any other node to select it as the point to create a sub-graph between. In this case, we will choose “git2.h”
Voila’… we have a simple graph we can manage visually and mentally and track down what’s going on in the include pre-processor action between them
To make that super easy, I’ve engaged the “Previewer” window by choosing “View->Previewer”
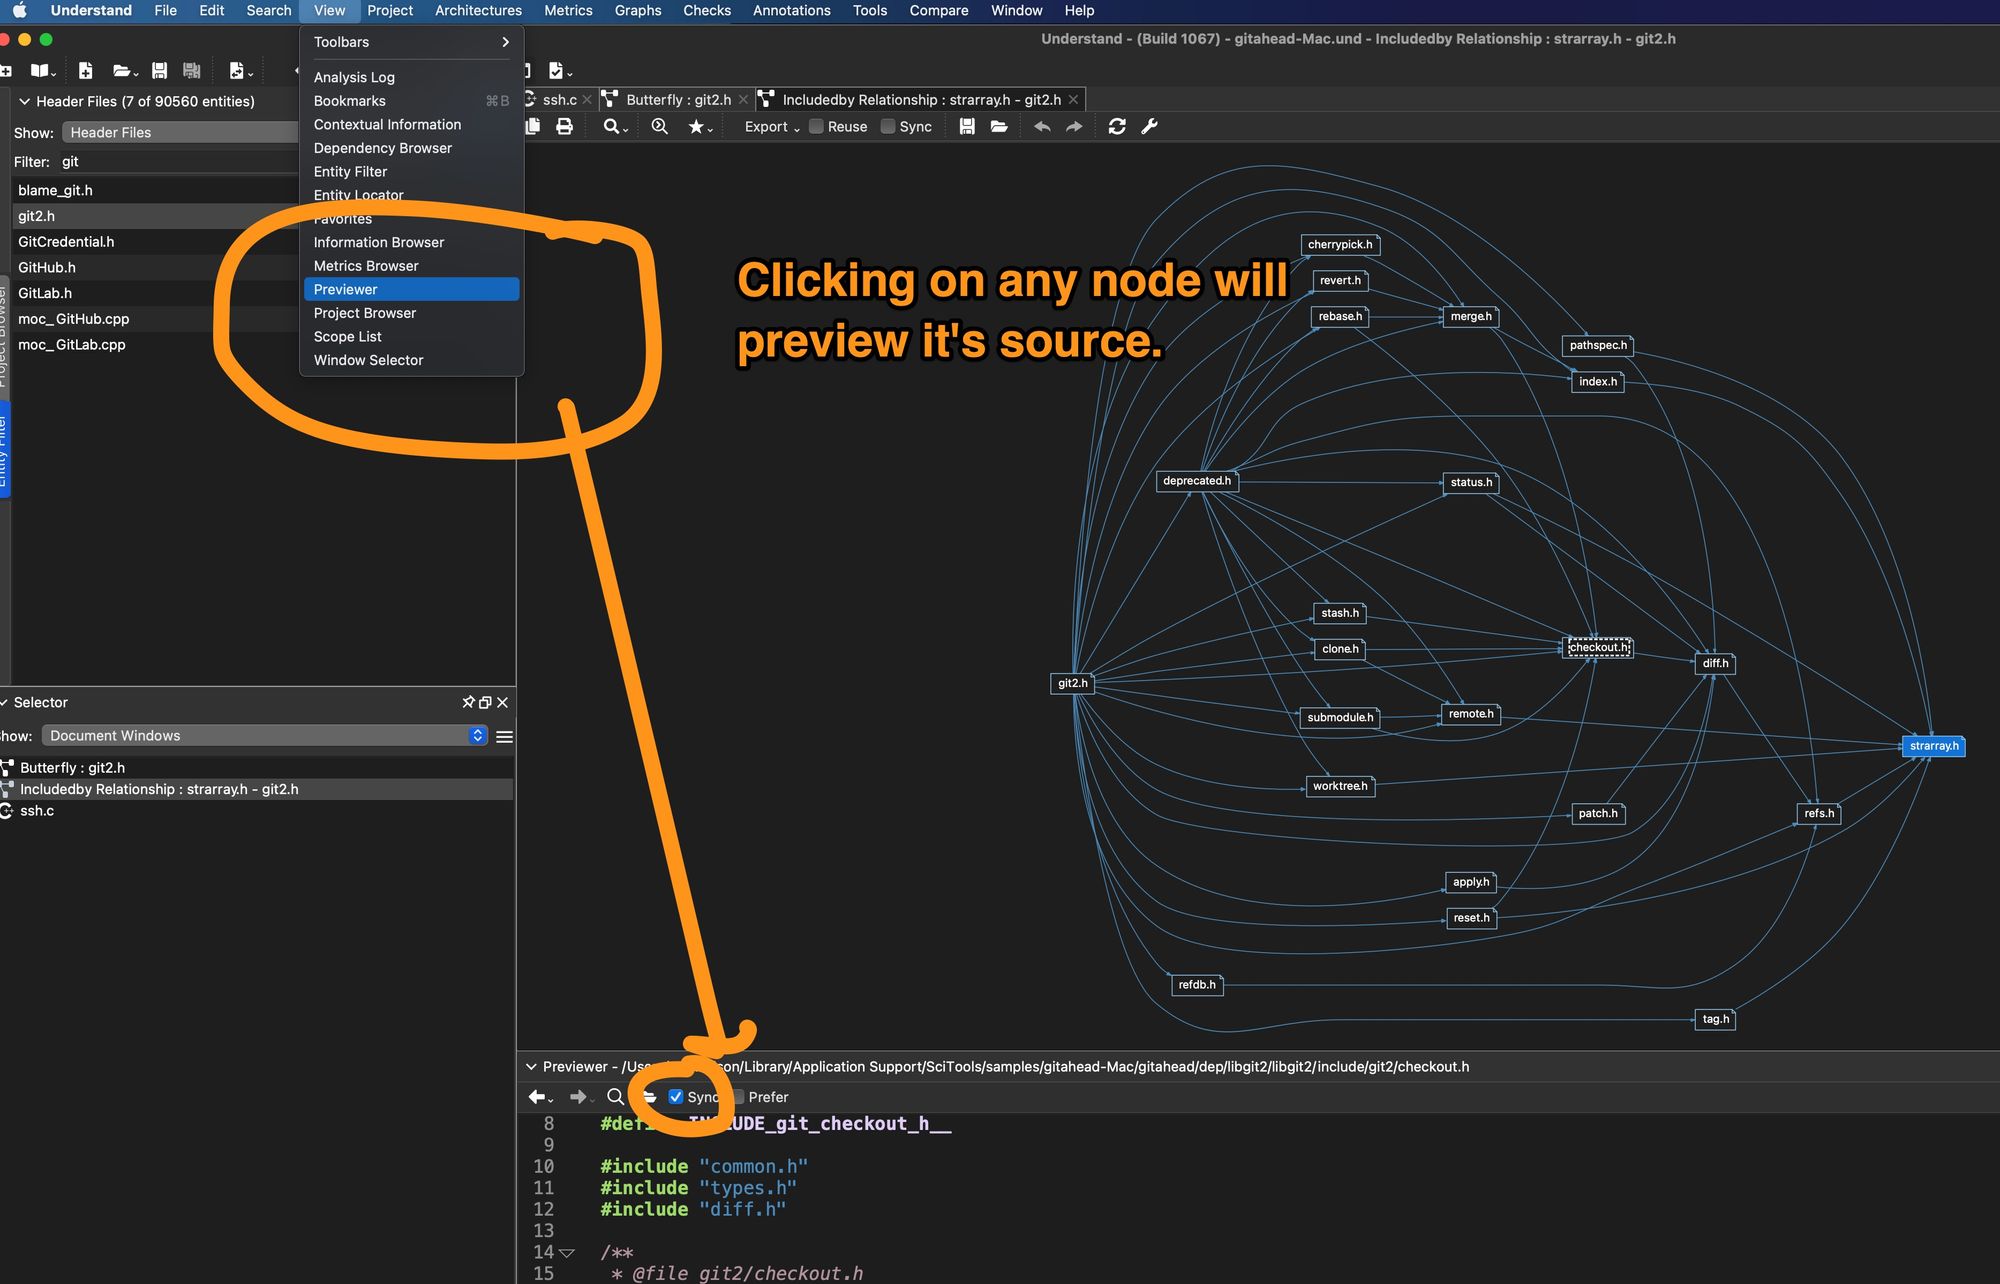
I can then click each node, explore using the Previewer and other Understand tools as needed. I can easily keep track of where I’ve been and the places I need to go because the new graph is smaller and only covers the area of interest.
“Relation” graphs aren’t limited to just include trees. Any hierarchical relationship in Understand has them available.
For instance, here is a large Call Tree of the “main” in a COVID infection model source code (https://github.com/mrc-ide/covid-sim).

Yikes!
I’m interested in looking at how the code handles people with immunity because the code doesn’t factor in vaccines (which didn’t exist when it was written).
To do this I’m going to walk down from main to the function “is_immune_at_start“, and to make that easier I’m going to reduce this graph to just the ways from main to that function. I’ll right-click on “is_immune_at_start” and choose “CallBy Relations”
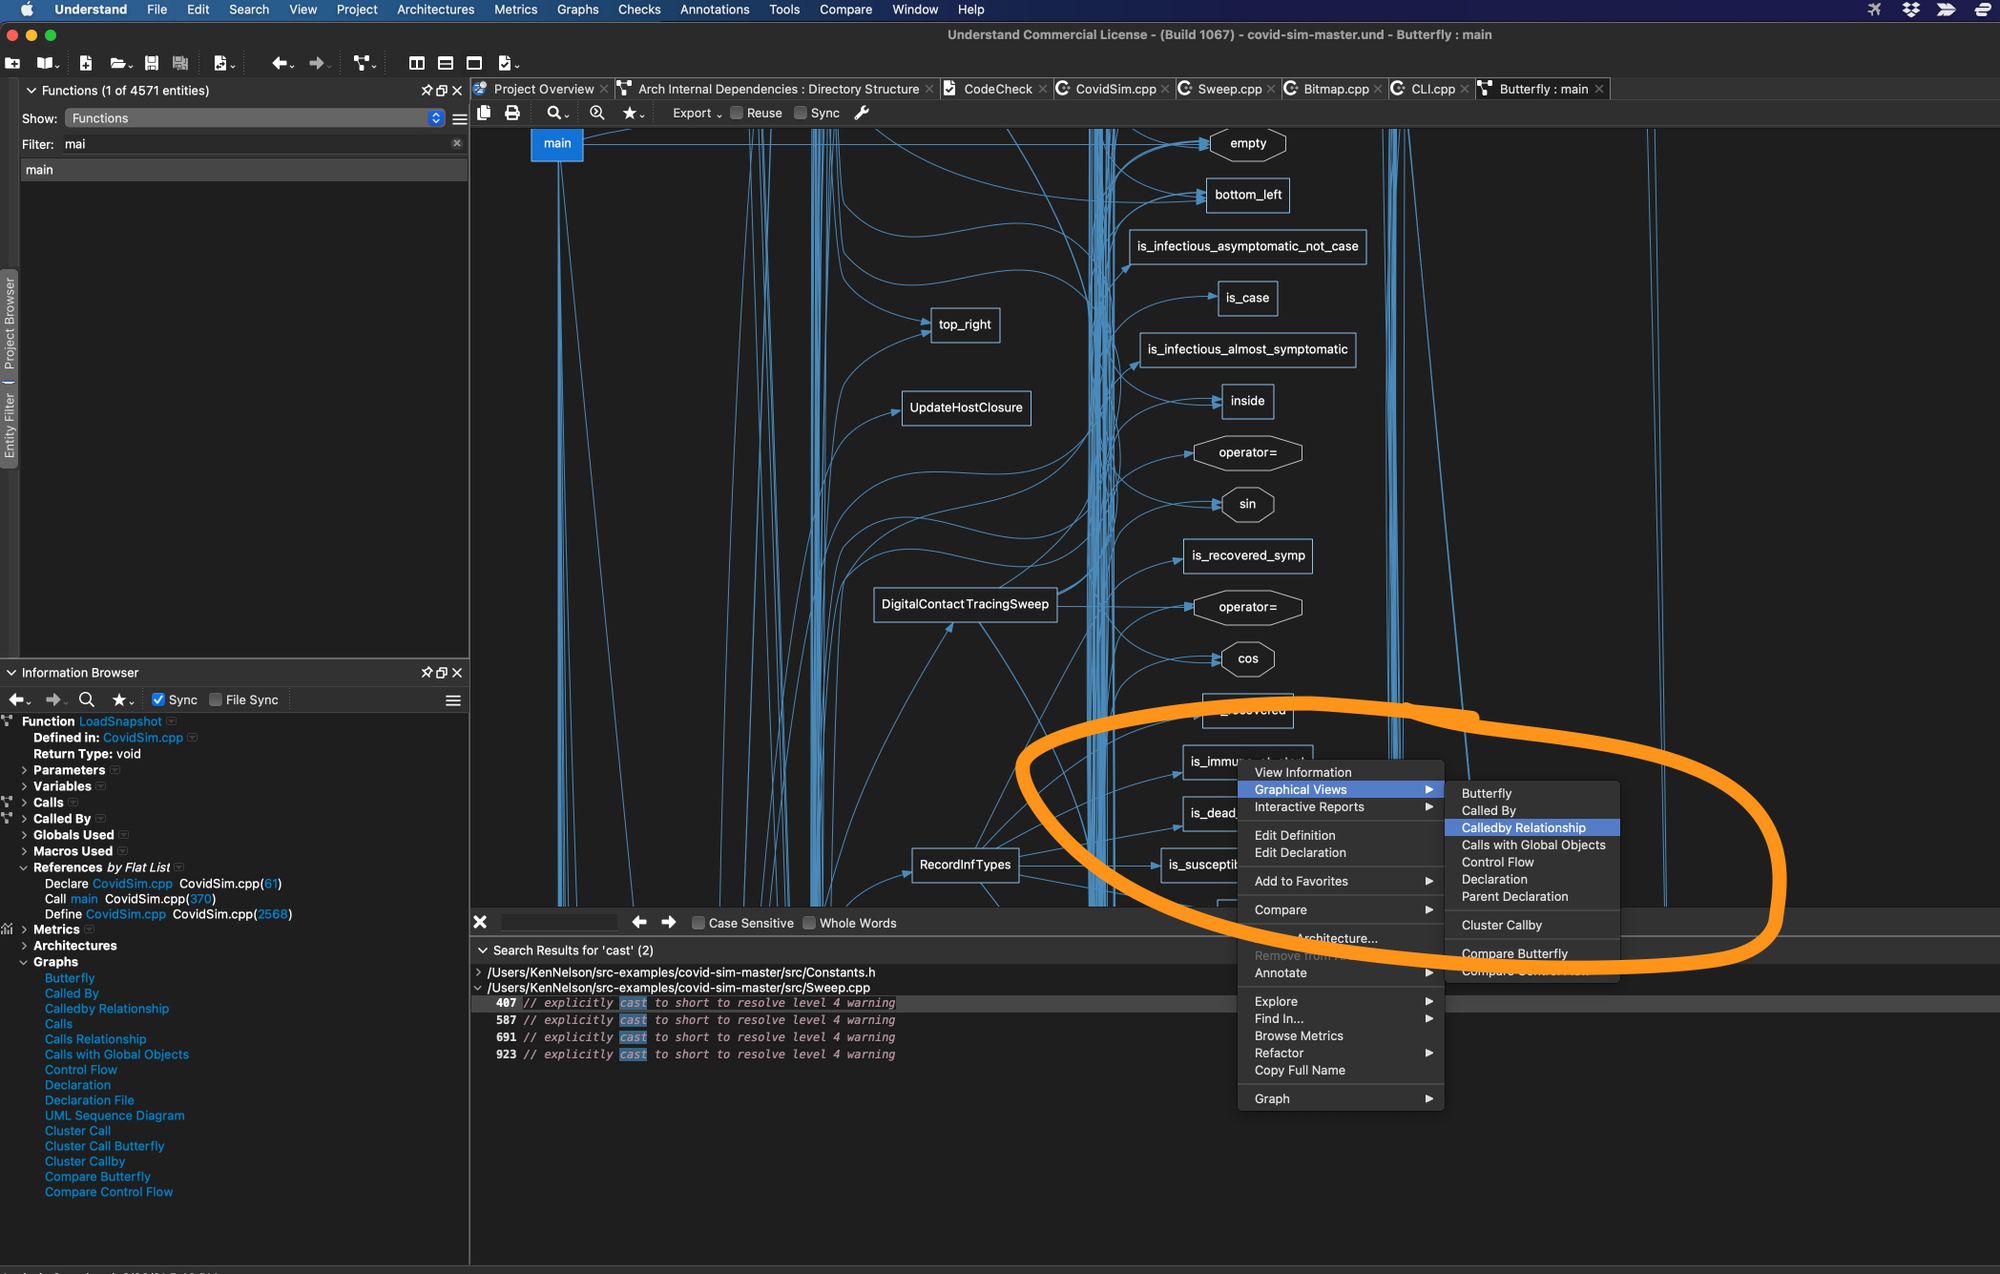
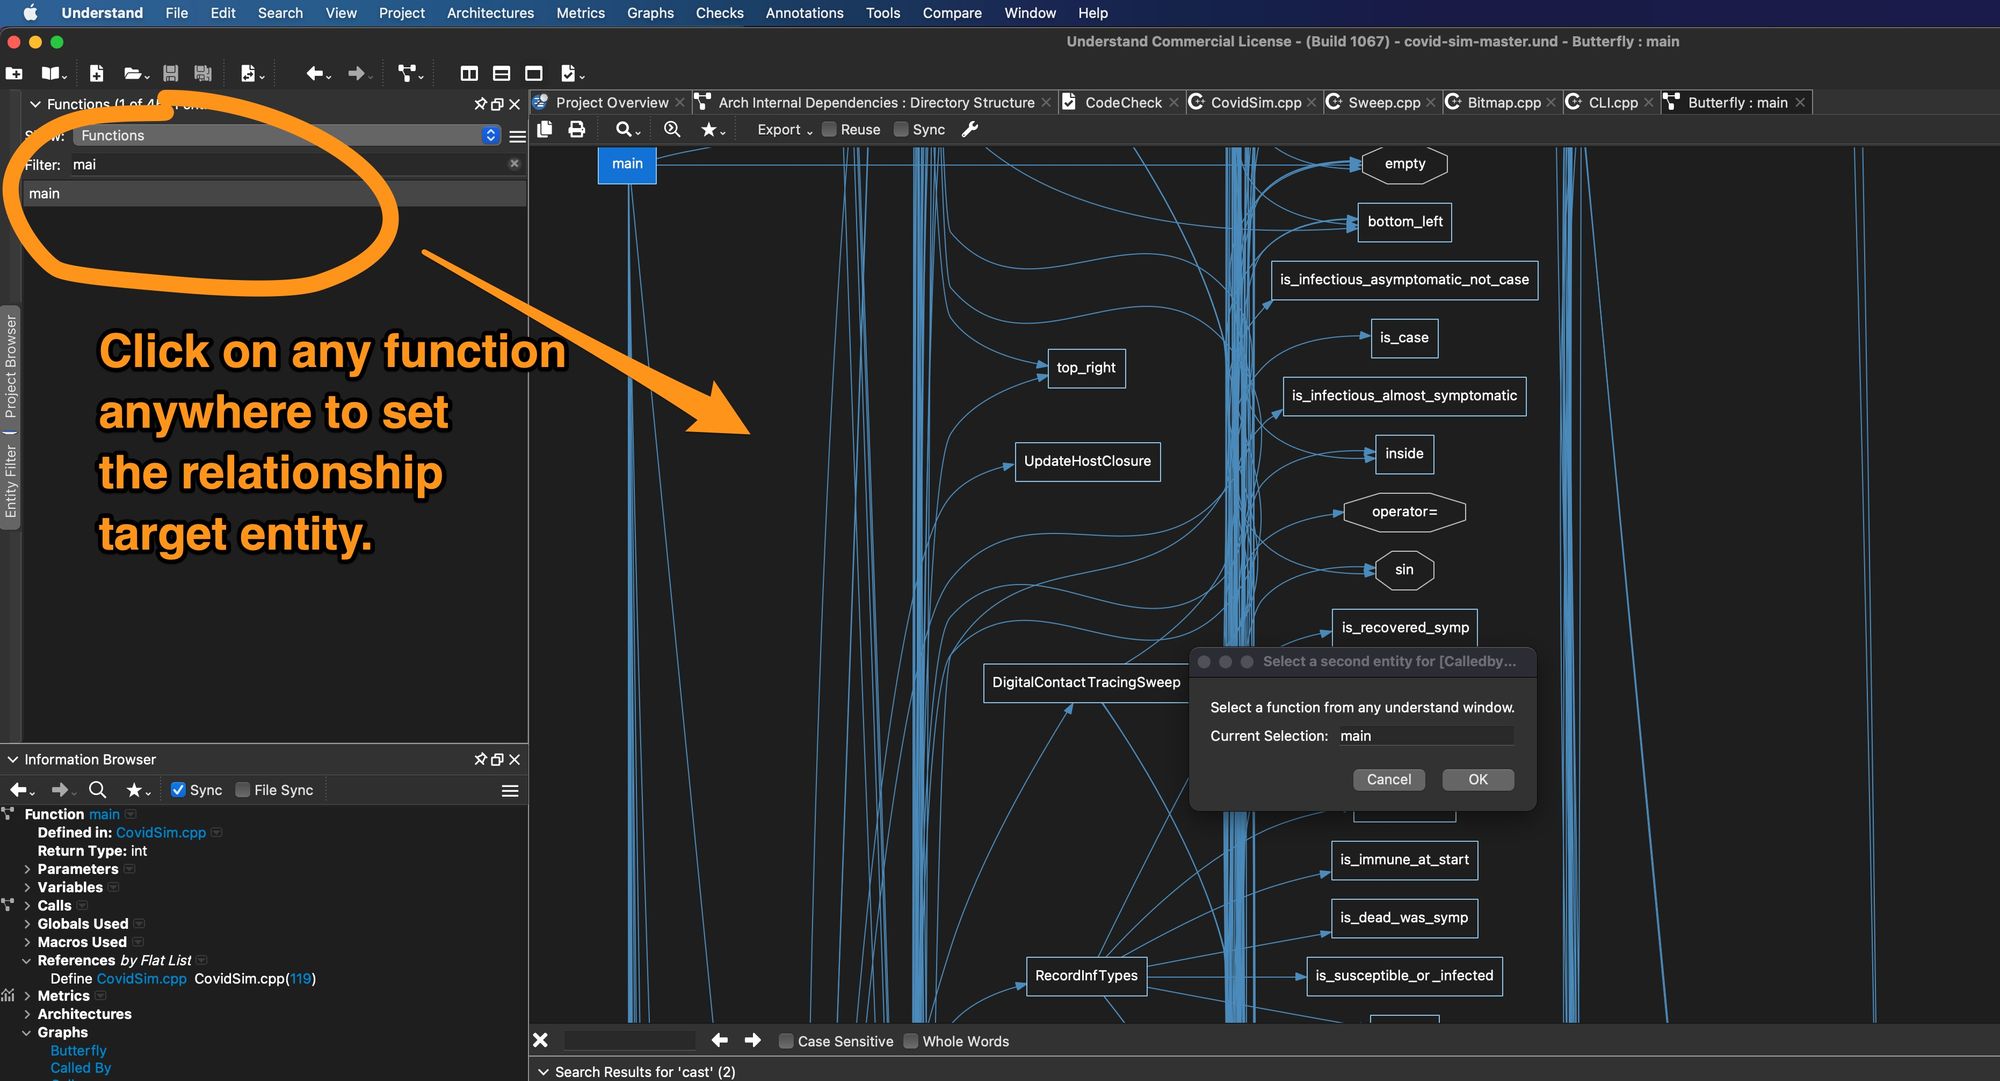
I can then find “main” – anywhere, in a graph, in the entity filter, or even in source code, and click it and it becomes the relation target:
And the result is a nice easy to understand graph I can traverse using the Previewer.

From complicated to simple – just like that.

