Skip to content
SciTools Blog
Menu
  • Home
  • Blog
  • Support
  • Contact
  • Login
  • Pricing
  • Free Trial
Menu
drafting instruments on top of table

Metric Plugins

Posted on June 6, 2023

Abstract: Understand 6.4 let’s you create your own metrics.

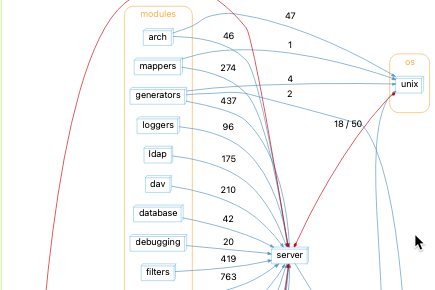
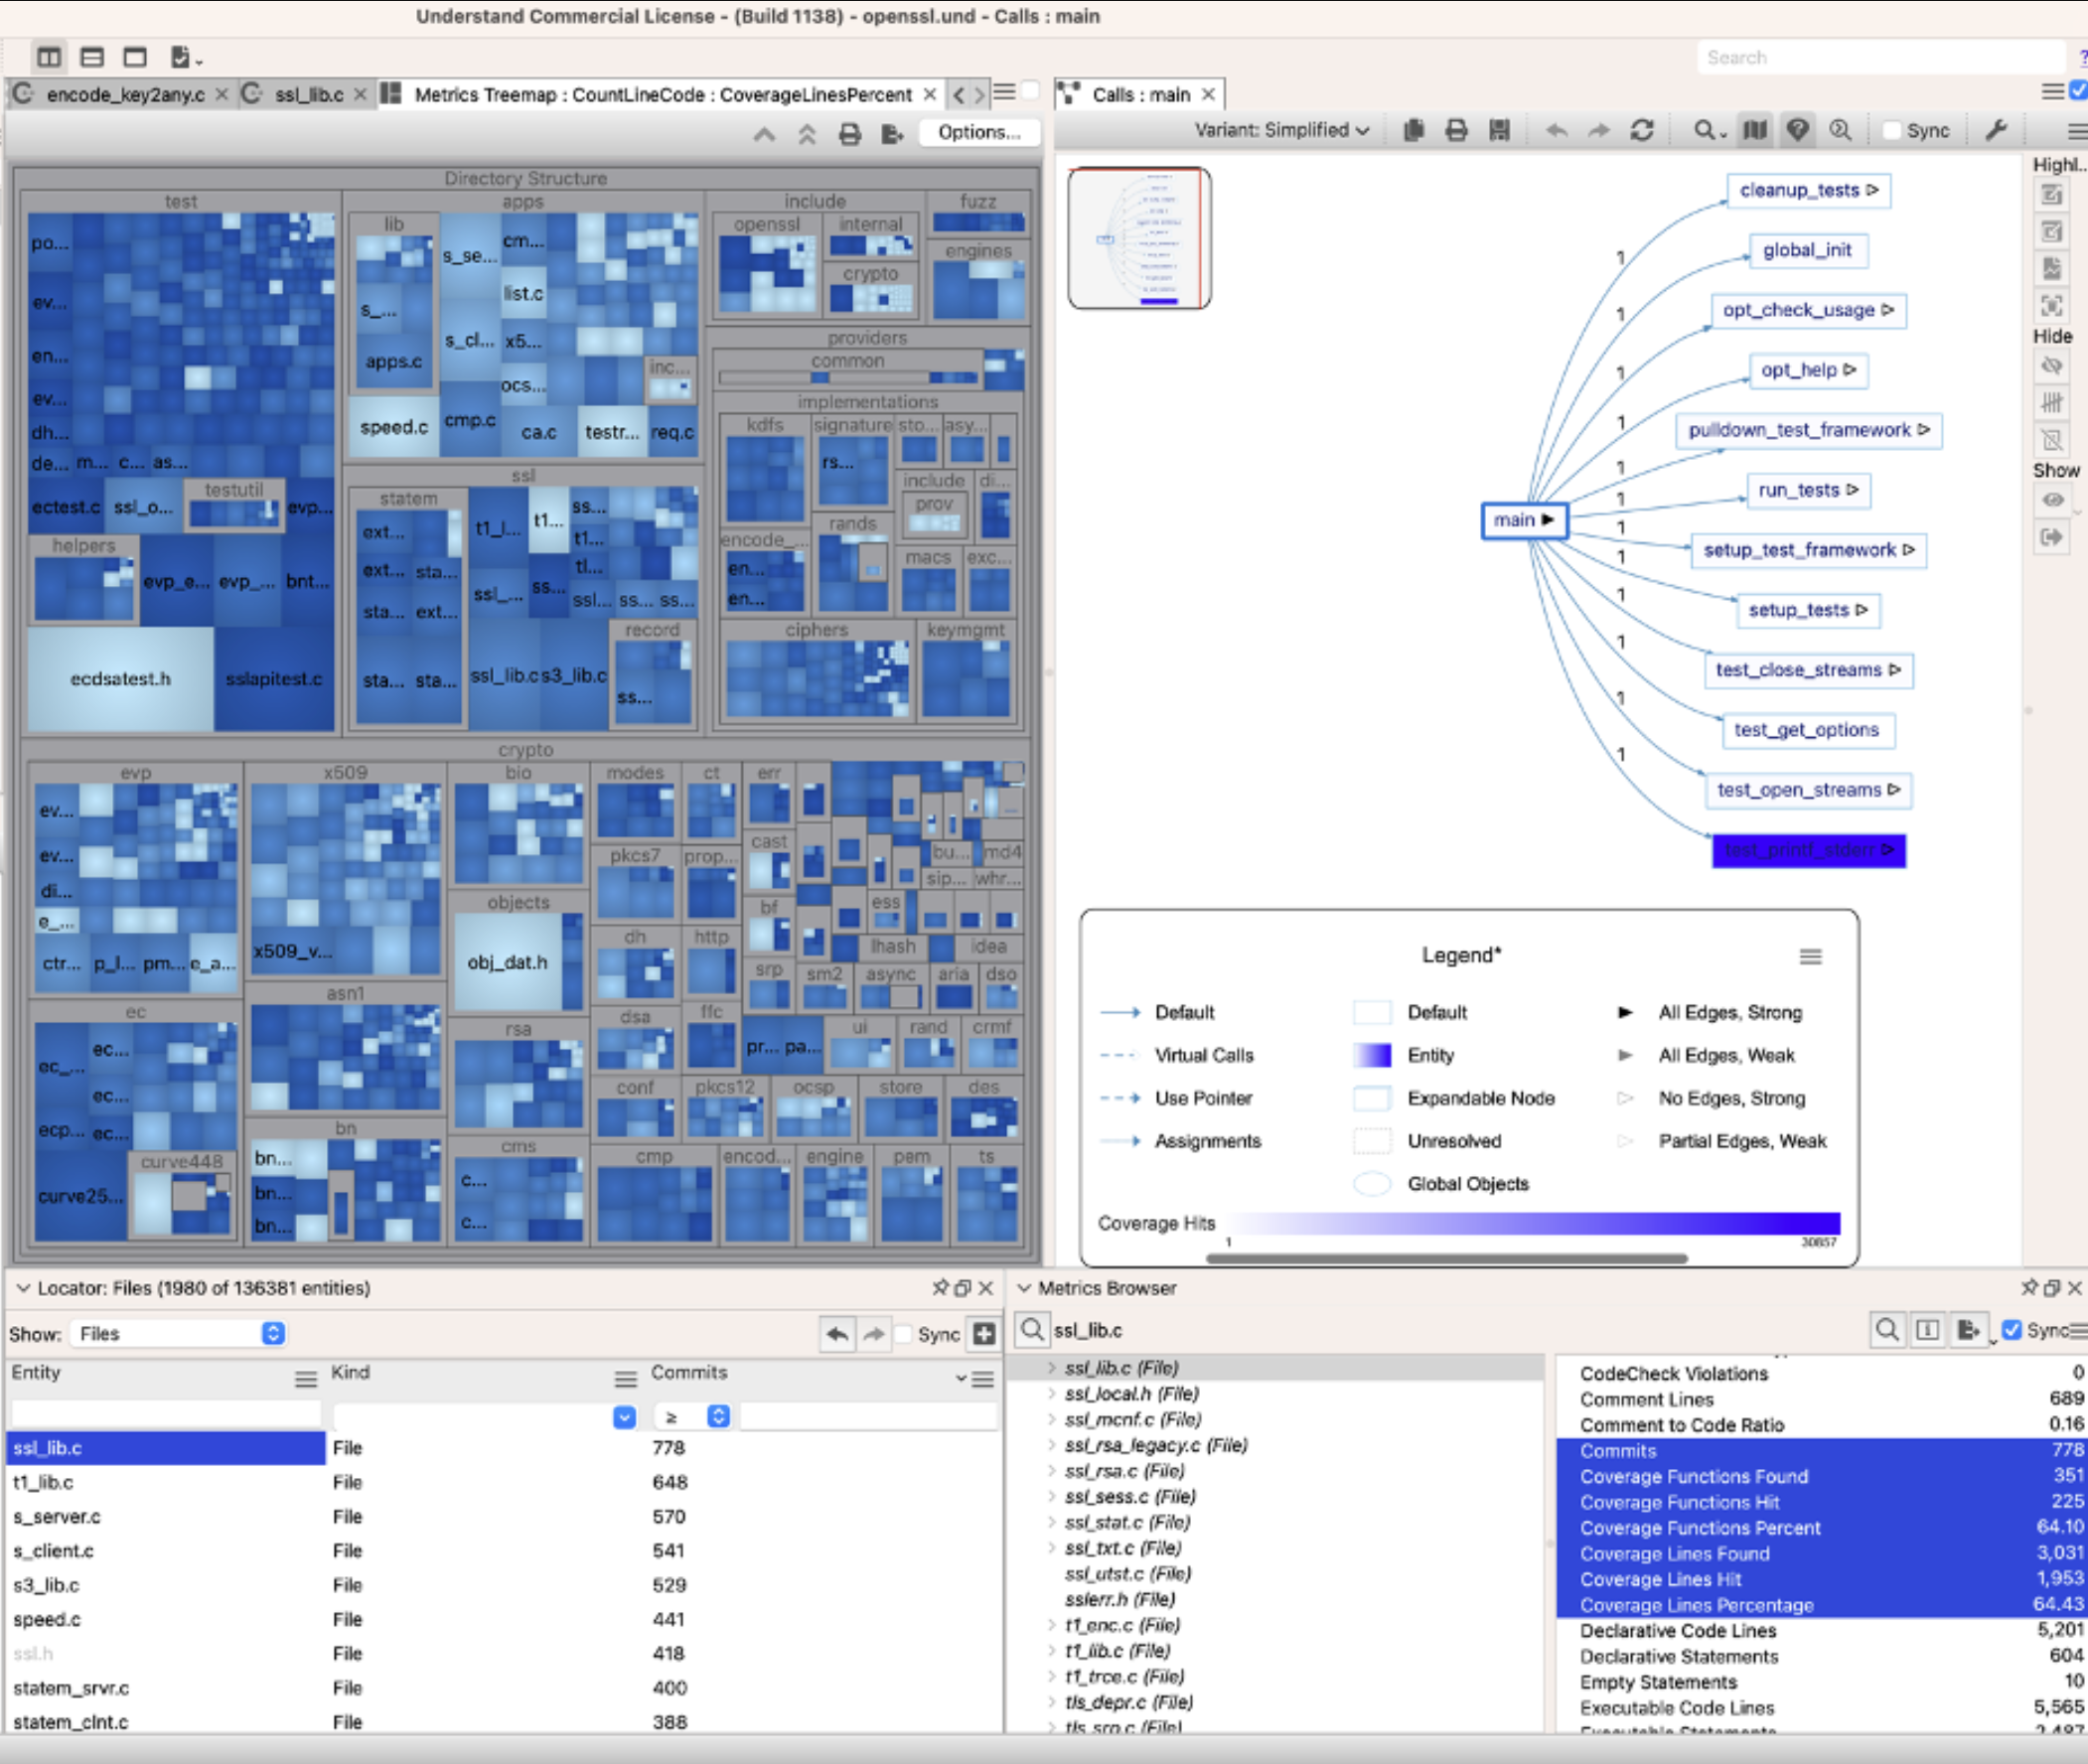
Understand comes with a lot of built-in metrics, like the number of code lines or the McCabe cyclomatic complexity of a function. Not only can you view and export these values, but you can also use them in other Understand views. For example, you can shade the nodes in a call tree by cyclomatic complexity, find outliers with treemaps, or sort by metrics in the locator.

A Metric’s Treemap for OpenSSL with size by lines of code and coloring by maximum cyclomatic complexity. A Call Tree with nodes colored by cyclomatic complexity. The Entity Locator showing the Comment to Code Ratio.

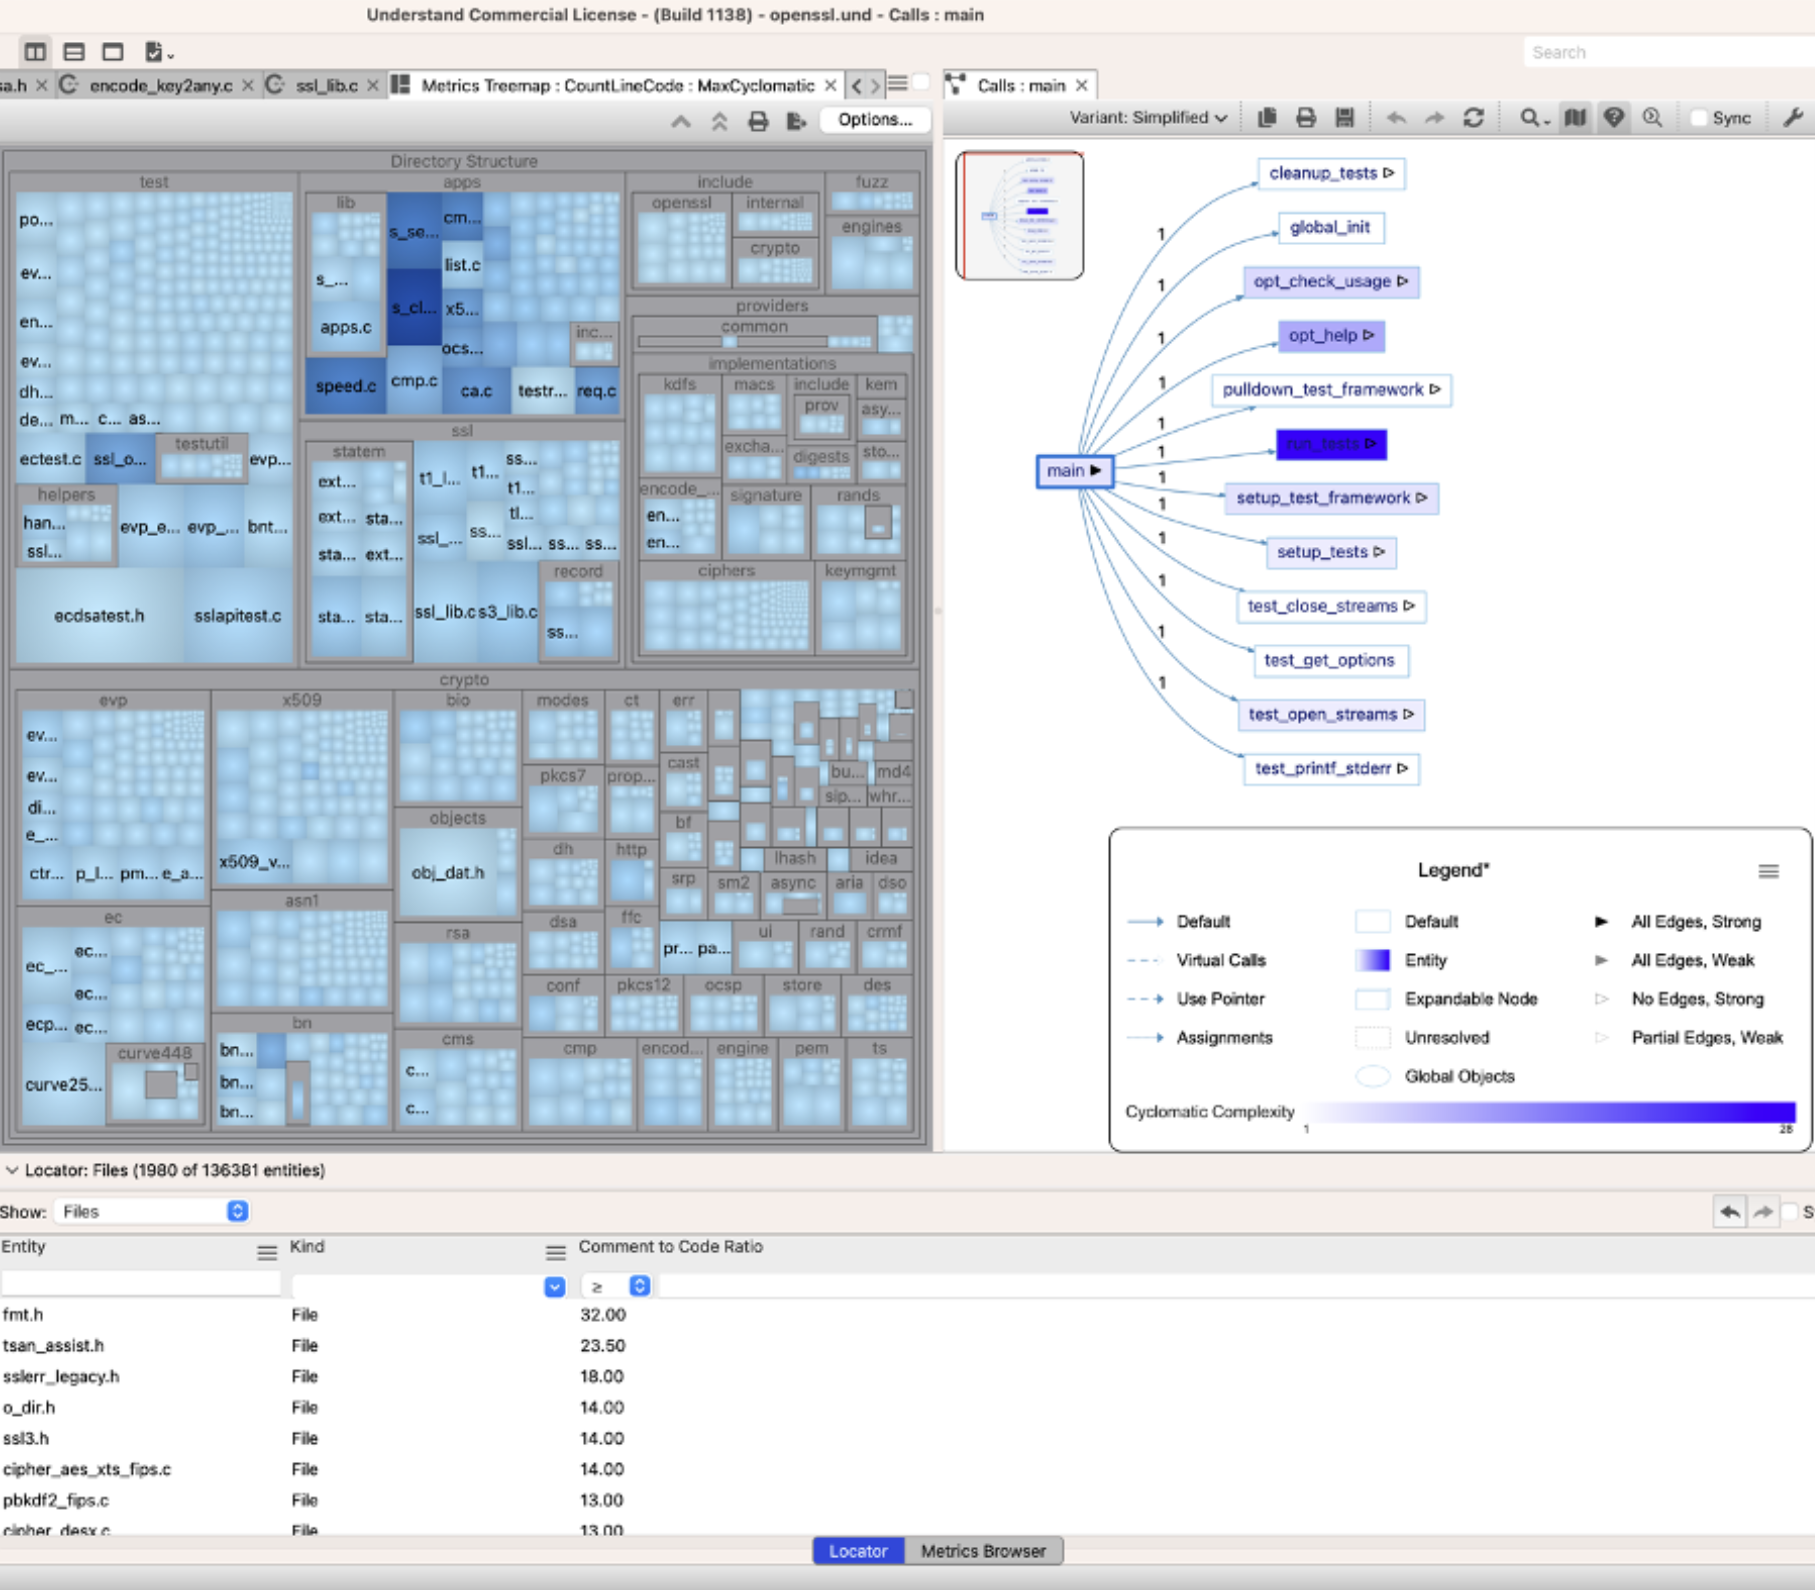
But, what if you wanted a call tree shaded by test coverage or by Git churn? Understand 6.4 allows you to add metrics plugins!

Understand Plugins

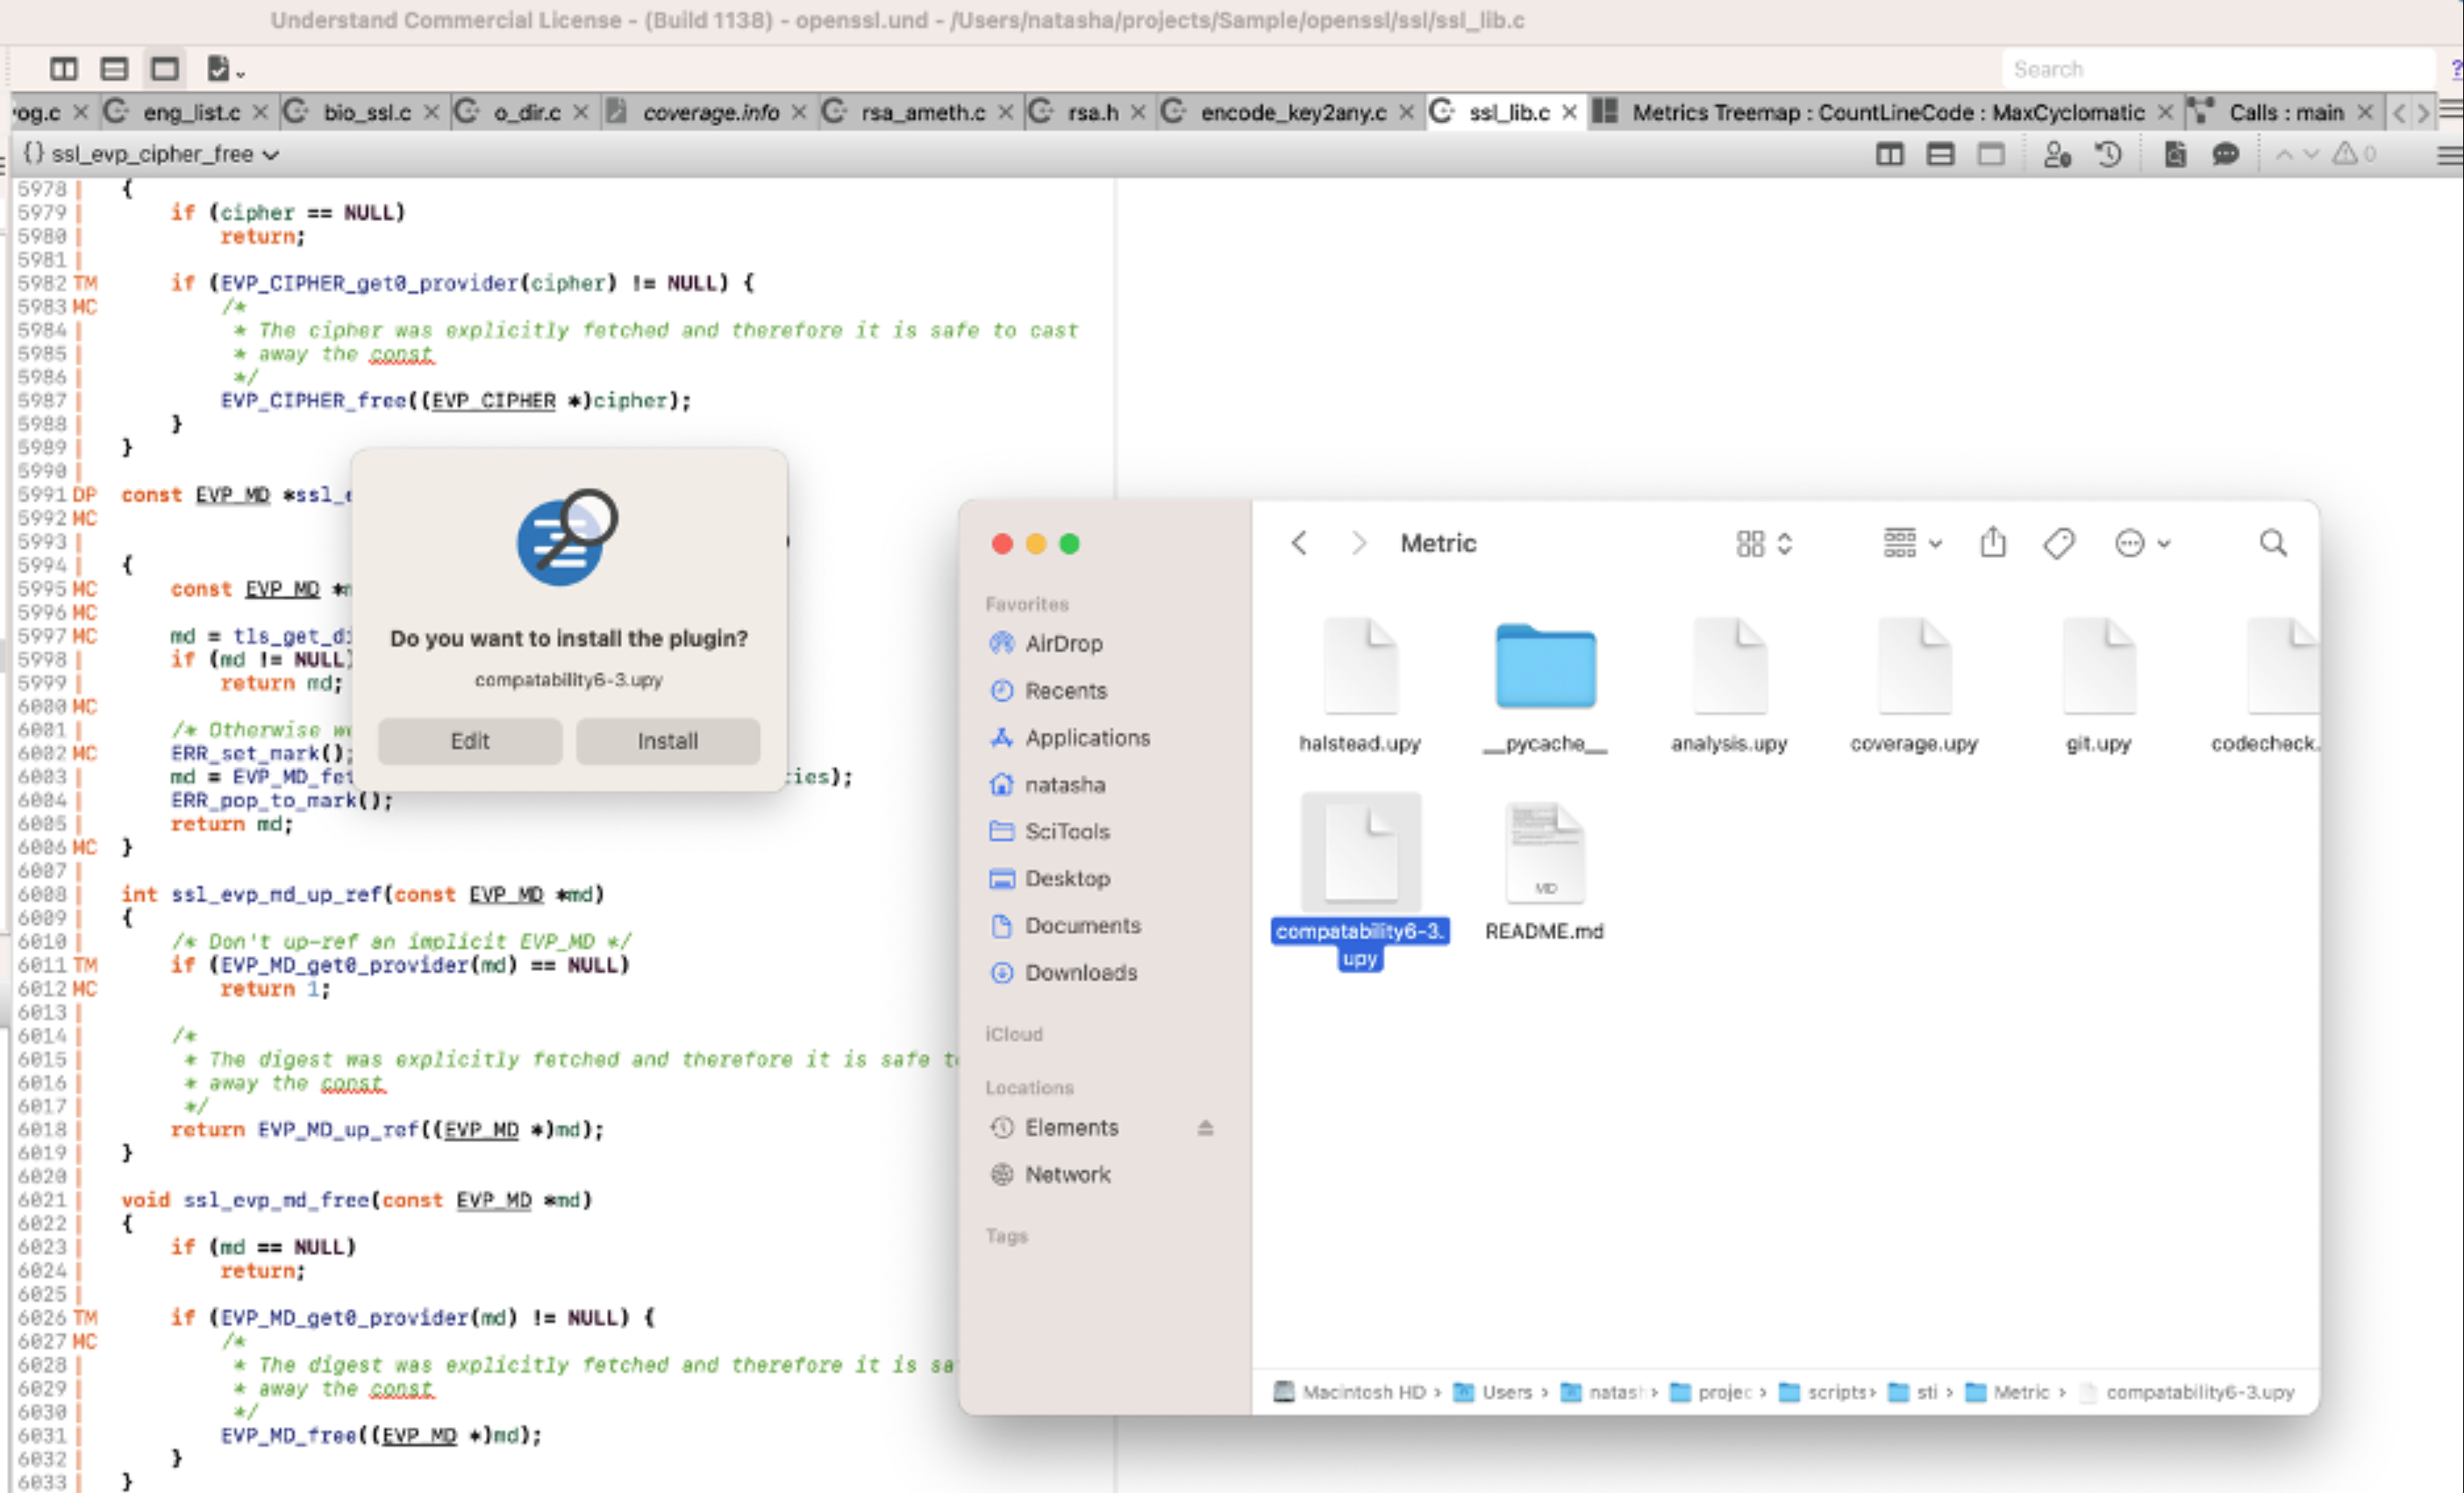
Understand plugins are Perl or Python scripts, usually ending in a .upl or .upy extension respectively. They can be used for graphs, CodeCheck checks, and interactive reports. Just drag the .upy or .upl file onto the Understand GUI and select install. 

Drag plugin files onto the Understand GUI to install them.

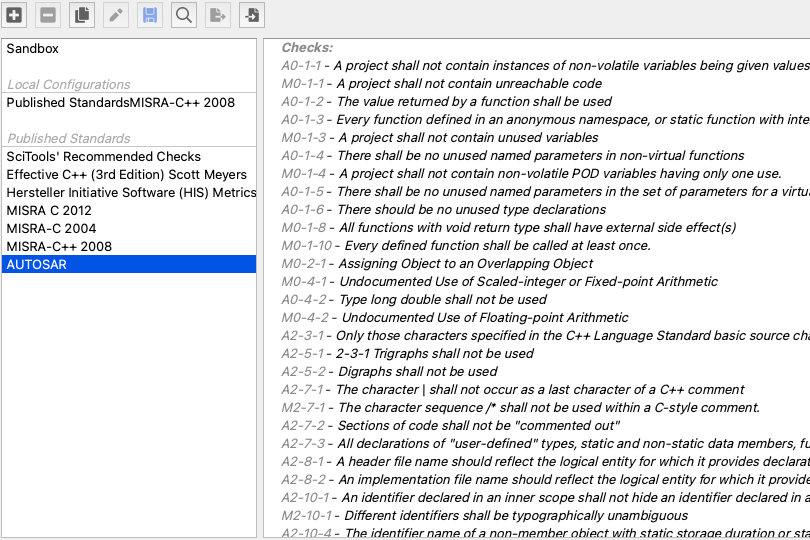
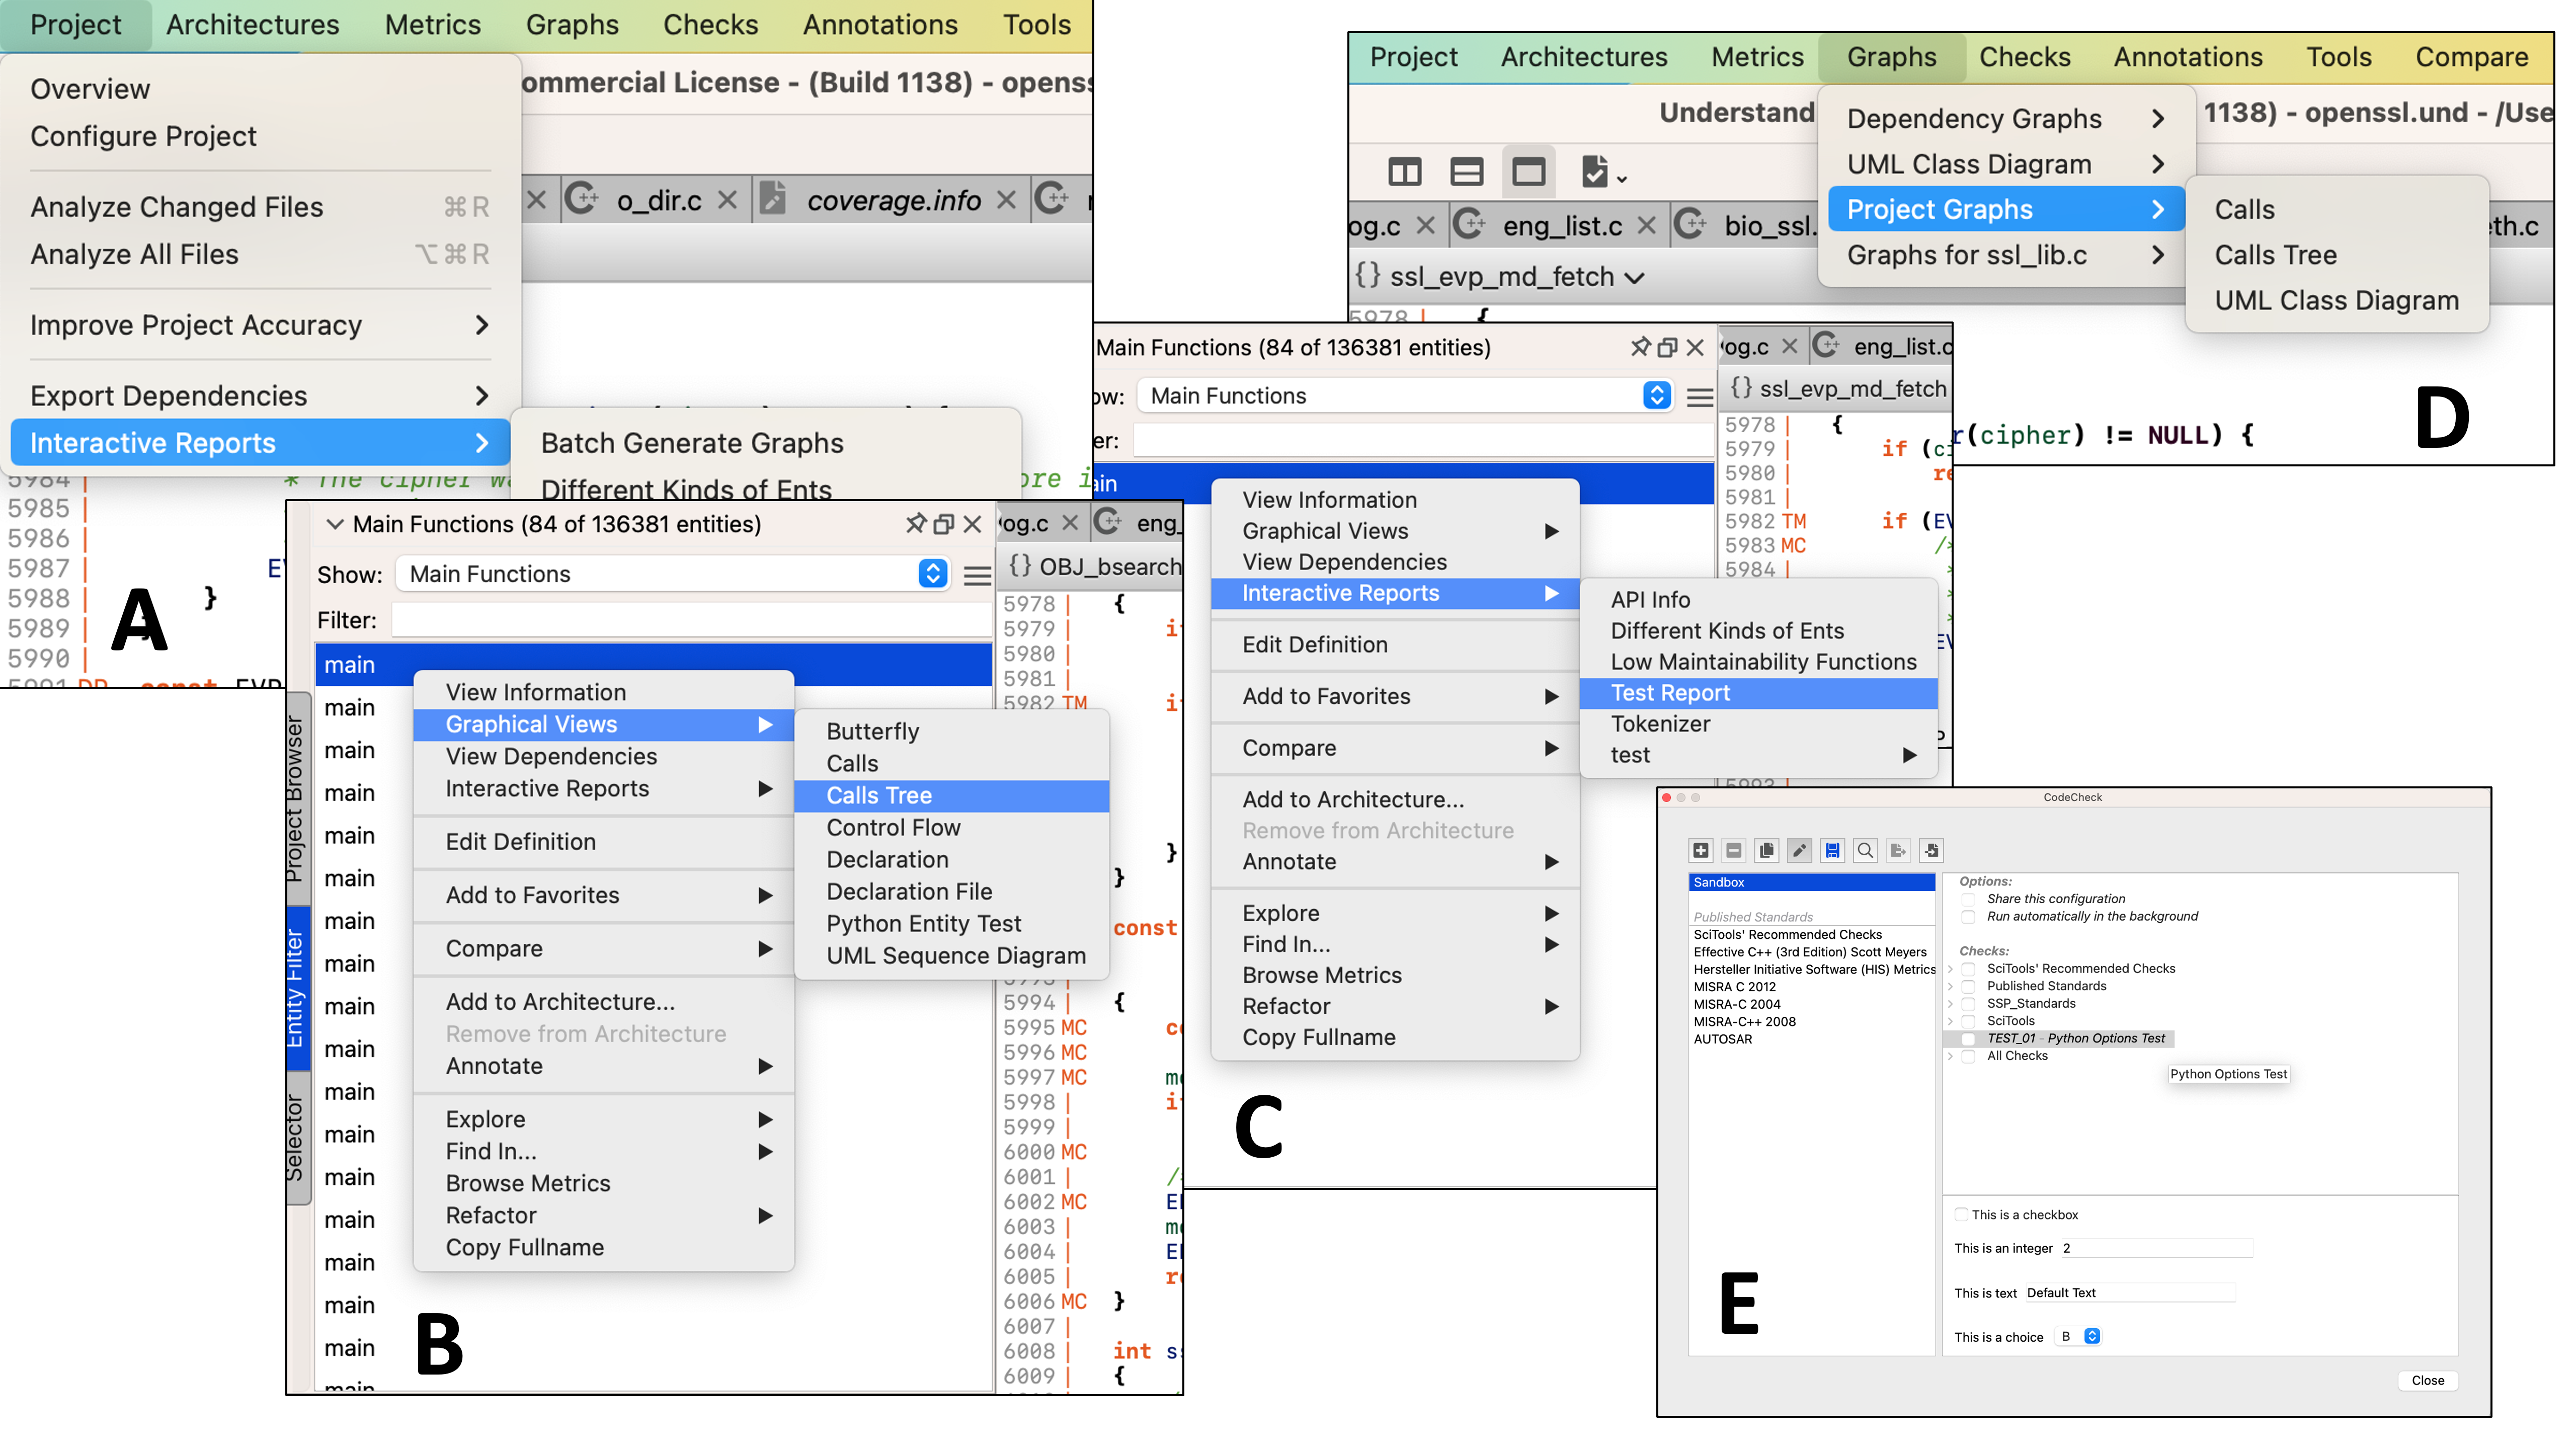
Plugins then populate menus or options in the Understand user interface:

(A) Project interactive reports appear in Project -> Interactive Reports. (B) Entity and architecture graphs appear in the context menu under Graphical Views. (C) Entity and architecture interactive reports appear in the context menu under Interactive Reports. (D) Project graphs appear in Graphs -> Project Graphs. (E) CodeChecks appear in the CodeCheck configuration dialog grouped by name.

Metric Plugins

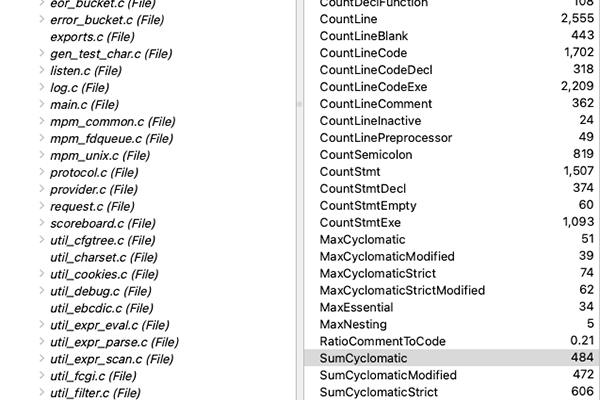
Metric plugins are Python scripts (Perl is not supported) and can be installed the same as any other Understand plugin. Once installed, the metrics will appear in any metric list where they’re applicable. 

A metric treemap using the the custom metric “CoverageLinesPercent.” A call graph shading by “CoverageHits.” The entity locator sorting files by the custom metric “Commits.” The Metrics Browser with several custom metrics highlighted.

How to Write Your Own Metric Plugin

Check out some of the existing metric plugins at our plugin repository. The compatability6-3 plugin is the template plugin described in the Python API documentation. It can be a great place to start.

The main function of a Metric Plugin is the “value” function which should return a number. It takes a Metric plugin object with information about the requested metric and database and a target. The target can be an entity, architecture, or database. Note that database metrics are not directly visible in the Understand GUI. Instead, most database level metrics are architecture metrics that run on the “Directory Structure” architecture. Database metrics can be accessed from the Perl and Python APIs. 

The other functions in a metric plugin provide information about the metric (ID, name, description) and when it is available (test_entity, test_architecture, and so on). 

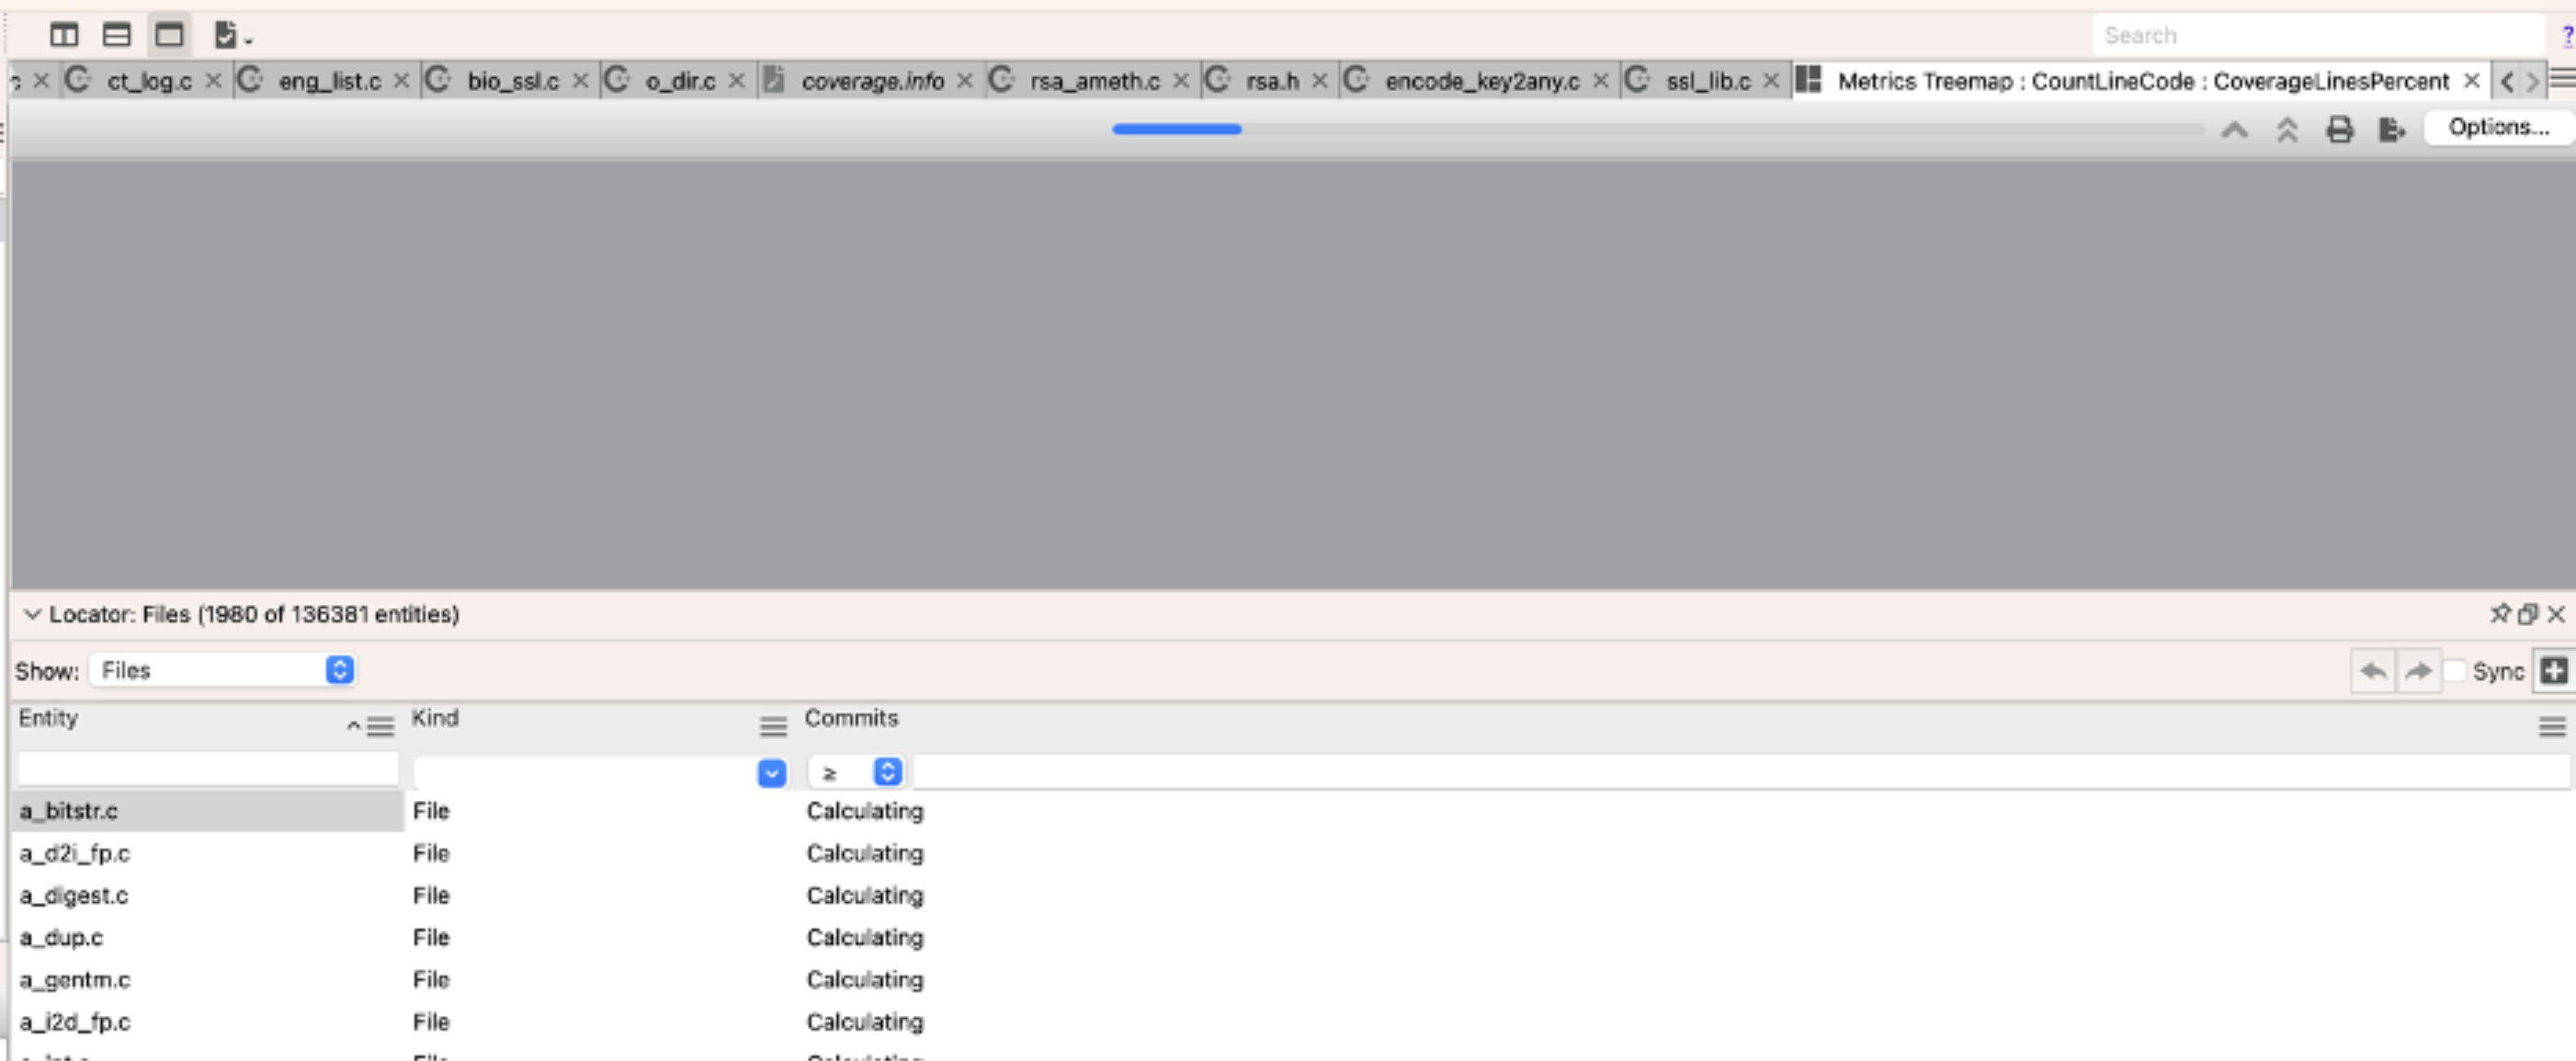
What if My Metric Plugin is Really Slow?

No problem. Most places that use Metrics are run on background threads. You might see “Calculating” text or progress bars, but the user interface should not hang. 

  • Instagram
  • Facebook
  • LinkedIn
  • Twitter
  • YouTube

Learn more about Understand's Features

  • Dependency Graph
    View Dependency Graphs
  • Comply with Standards
  • View Useful Metrics
  • Team Annotations
  • Browse Depenedencies
  • Edit and Refactor

Related

  • API
  • Architectures
  • Business
  • Code Comparison
  • Code Comprehension
  • Code Navigation
  • Code Visualization
  • Coding Standards
  • Dependencies
  • Developer Notes
  • DevOps
  • Getting Started
  • Legacy Code
  • Licensing
  • Metrics
  • Platform
  • Plugins
  • Power User Tips
  • Programming Practices
  • Uncategorized
  • Useful Scripts
  • User Stories
  • May 2025
  • January 2025
  • December 2024
  • November 2024
  • August 2024
  • June 2024
  • May 2024
  • March 2024
  • February 2024
  • January 2024
  • December 2023
  • November 2023
  • October 2023
  • September 2023
  • August 2023
  • June 2023
  • April 2023
  • January 2023
  • December 2022
  • November 2022
  • September 2022
  • August 2022
  • May 2022
  • April 2022
  • February 2022
  • January 2022
  • December 2021
  • November 2021
  • October 2021
  • September 2021
  • August 2021
  • July 2021
  • June 2021

©2025 SciTools Blog | Design: Newspaperly WordPress Theme