Abstract: Frustrated by vague code quality metrics? Explore how to translate CBR Insight’s metrics for file complexity, thresholds, and comment to code ratio into equivalent custom Understand metrics to gain a more nuanced understanding of your code’s quality.
97.
You have no idea what do with that number, right? After all, I didn’t give any units or any frame of reference for this number. Suppose I add units: 97 scorpions discovered inside my house. Now, hopefully, the number invokes a sense of pity for this author.
But how much pity should you feel? You still need a frame of reference.
Personally, I have a threshold. Any number of scorpions greater than 0 is too many. So the number is unquestionably bad. But thresholds aren’t always known.
Without a threshold, what can you use as a frame of reference? One option is to survey the neighborhood. Suppose scorpions have ranged from 0 to 300 in my neighborhood with most people having around 50. By the way, none of my neighbors track their scorpions as diligently as I do so this kind of study has not yet been possible. But, with the fake results, you could conclude that 97 scorpions is bad but not terrible since it’s worse than average but not the worst.
CBR Insight
Software metrics and scores face the same problem. Some metrics, like cyclomatic complexity, have thresholds provided by the author. But other metrics, like the comment to code ratio, are more vague. How do you decide if a particular comment to code ratio is good or not?
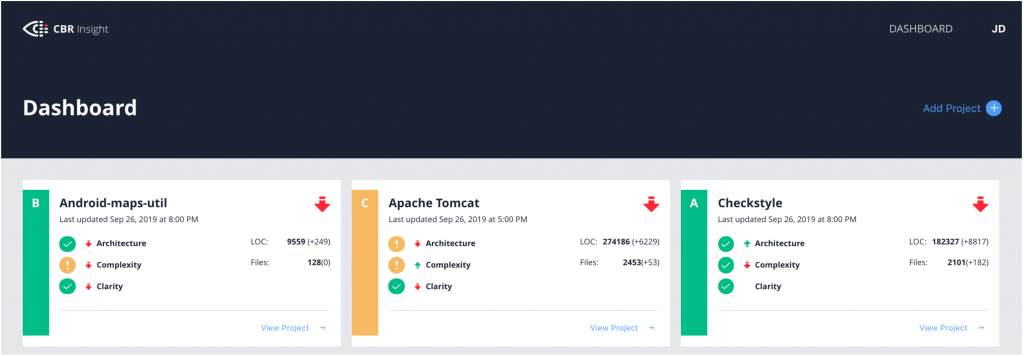
I’ve been reading about CBR Insight (“A Case Study Using CBR-Insight to Visualize Source Code Quality” Ludwig, 2020), an open-source tool that essentially scans the neighborhood to provide context for metrics. Understand is used to calculate a set of project metrics, and the metrics are compared to similar projects from GitHub. The percentile of a project relative to its neighbors is used to assign scores.
Scores
CBR Insight provides four scores per project: an overall score, an architecture score, a complexity score, and a clarity score. The overall score combines the other three scores, and each of those scores comes from two metrics.
- The architecture score is based on the core size and propagation cost.
- The complexity score is based on the percentage of overly complex files and the percentage of duplicate lines of code.
- The clarity score is based on the comment density (comment to code ratio) and a manual evaluation.
Other than the comment to code ratio, none of the metrics appear directly in Understand. CBR Insight includes an interactive report to generate the values from Understand. In this article, I want to convert that interactive report into a metric plugin so that I can directly access the metrics from Understand.
A previous blog article already describes the architecture metrics used, and there are corresponding plugins. So that information won’t be repeated here. Instead, I’m going to focus on overly complex files and briefly touch on duplicate lines of code and comment to code ratio.
Overly Complex Files
From CBR Insight, an overly complex file “exceed[s] accepted thresholds in 4 out of 5 categories”. The categories are:
- LOC (Lines of Code)
- WMC Unweighted (Weighted Method Count – Unweighted)
- WMC-McCabe (Weighted Method Count – McCabe)
- RFC (Response for Class)
- CBO (Coupling Between Objects).
(“Compiling Static Software Metrics for Reliability and Maintainability from GitHub Repositories” Ludwig, 2017). It turns out that every one of those five metrics is modified a bit from Understand. Let’s look at each one in turn.
Lines of Code
Understand has a lines of code metric. I’ll refer to Understand metrics by their name followed by the id in parentheses. The lines of code metric is “Code Lines” (CountLineCode). However, CBR Insight does not use this value directly. Instead, there’s a concept of a “useless” line of code. From the CBR Insight interactive report:
      $line =~ s/\s//g; #remove whitespace
      if ($line =~ /^[\{\};\(\)]+$/){
        $uselessCount++;
      }
So, reverse engineering, a useless line of code is a line of code that contains only braces, parentheses, semicolons, and whitespace. Then the useful lines of code is Understand’s CountLineCode value minus the number of useless lines.
I’ll call this metric “CBRI Useful Lines of Code” (CBRIUsefulLOC) for my plugin.
Weighted Method Count – Unweighted
WMC is one of six object oriented metrics defined by Chidamber and Kemerer in their metric suite (1994). In its unweighted form, it is the number of methods defined in the class. In Understand, it’s “Methods” (CountDeclMethod).
However, “Methods” is a class metric, not a file metric. How to calculate a class metric for a file? If the file defines classes, then it’s the maximum “Methods” value for any class defined in the file.
If the file doesn’t have classes, then the sum of the two file metrics “Functions” (CountDeclFunction) and “Subprograms” (CountDeclSubprogram) is used instead. The difference between “Functions’ and “Subprograms” is the languages they apply to.
For my plugin, this value will be “CBRI Max WMC” (CBRIMaxWMC).
Weighted Method Count – McCabe
WMC-McCabe is the sum of the McCabe cyclomatic complexity for each method in the class. The McCabe cyclomatic complexity is “Cyclomatic Complexity” (Cyclomatic) and the WMC-McCabe is “Sum Cyclomatic Complexity” (SumCyclomatic).
Again, we have the difference between a file with classes and a file without classes. In a file with classes, the maximum “Sum Cyclomatic Complexity” is used. Aggregated complexity values like “Sum Cyclomatic Complexity” are available for both files and classes. However, when there are no classes, the value for the file used by CBR Insight is the “Max Cyclomatic Complexity” (MaxCyclomatic).
For my plugin, this value will be “CBRI Max WMC-McCabe” (CBRIMaxWMCM).
Response For Class
RFC is another Chidamber and Kemerer metric defined as the number of methods in the class plus the number of methods called by methods in the class. Understand has a metric “All Methods” (CountDeclMethodAll) that is sometimes used as the RFC. It differs from “Methods” by including inherited methods. However, it does not include all the called methods.
So, a true RFC value would be “All Methods” (or “Methods” depending on how inheritance is treated) plus all the called methods. How to find all the called methods? From the class entity, you’d have to get each defined method entity and then get the “calls” references from each method that went to another class method. That’s basically what dependencies do, so the CBR Insight plugin uses Understand’s dependencies. I don’t love reading Perl code, so here’s the equivalent python code:
def rfc(classEnt):
  # Methods called by class
  called = set()
  for depreflist in classEnt.depends().values():
    for depref in depreflist:
      if depref.kind().check("call") and depref.ent().kind().check("method, function"):
        called.add(depref.ent())

  return metric(classEnt, "CountDeclMethodAll") + len(called)
But, again, this value is for a file, not a class. So if the file has classes, then the maximum RFC is used. If there are no classes, the number of entities called by the file is used. So, the number for a file isn’t exactly a response for file because it doesn’t include functions that are only defined in the file but not called within the file.
For my plugin, this value will be “CBRI Max RFC” (CBRIMaxRFC).
Coupling Between Objects
The last metric is CBO. Similar to the WMC – unweighted, there is an exact match for this metric in Understand, the “Coupled Classes” (CountClassCoupled”). However, it is again a metric only for classes. So, if a file contains classes, the maximum value is used. A file with no classes uses the number of files the current file depends on.
For my plugin, this value will be “CBRI Max CBO” (CBRIMaxCBO).
Thresholds
Now we can finally decide if a file is overly complex. An overly complex file exceeds more than three thresholds. The thresholds can be changed when running CBR Insight‘s interactive report, but since metric plugins don’t have options, my metric plugin uses the defaults:
- Useful lines of code > 200
- WMC – Unweighted > 12
- WMC – McCabe > 100
- RFC > 30
- CBO > 8
The metric plugin reports the number of thresholds exceeded on a file as “CBRI Threshold Violations” (CBRIThresholdViolations). Now we can get to the overall project number. For the metrics plugin, this will be the “CBRI Overly Complex Files” (CBRIOverlyComplexFiles). The metric is defined for architectures and the database as a whole and simply counts the number of files whose CBRIThresholdViolations is greater than 3.
Metric Plugin Sneak Peak
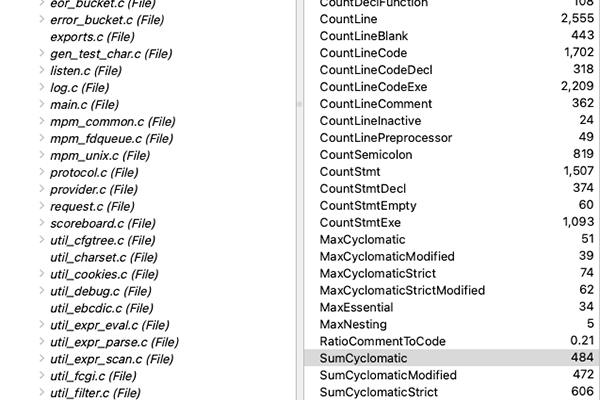
At this point we’ve defined six new file metrics and one new architecture metric. Actually, the useful lines of code is also available as an architecture metric, just summing over the file values. So, let’s test it out on OpenSSL since it’s my default metrics test database. For a file, I have these six new values:
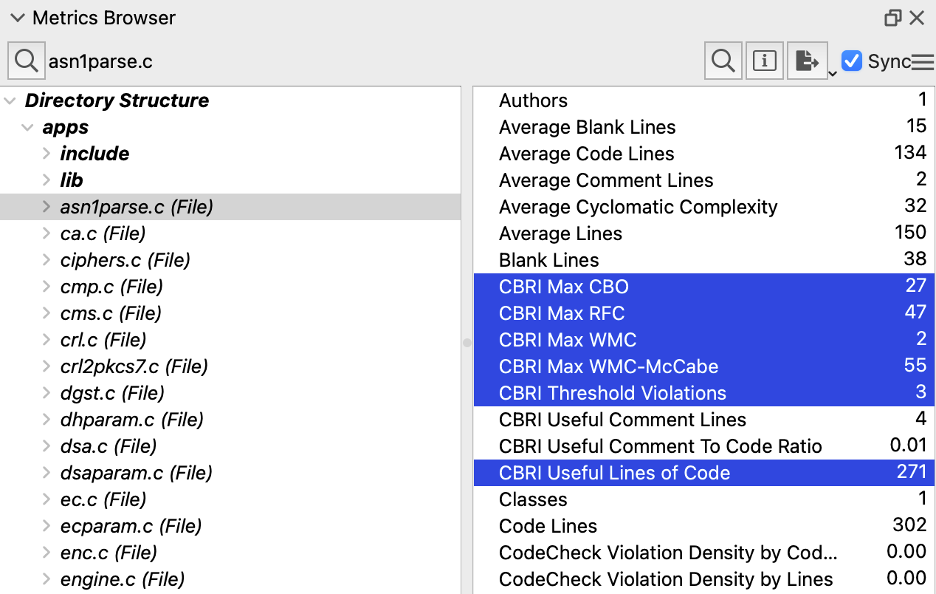
And for the architecture, these two new values:
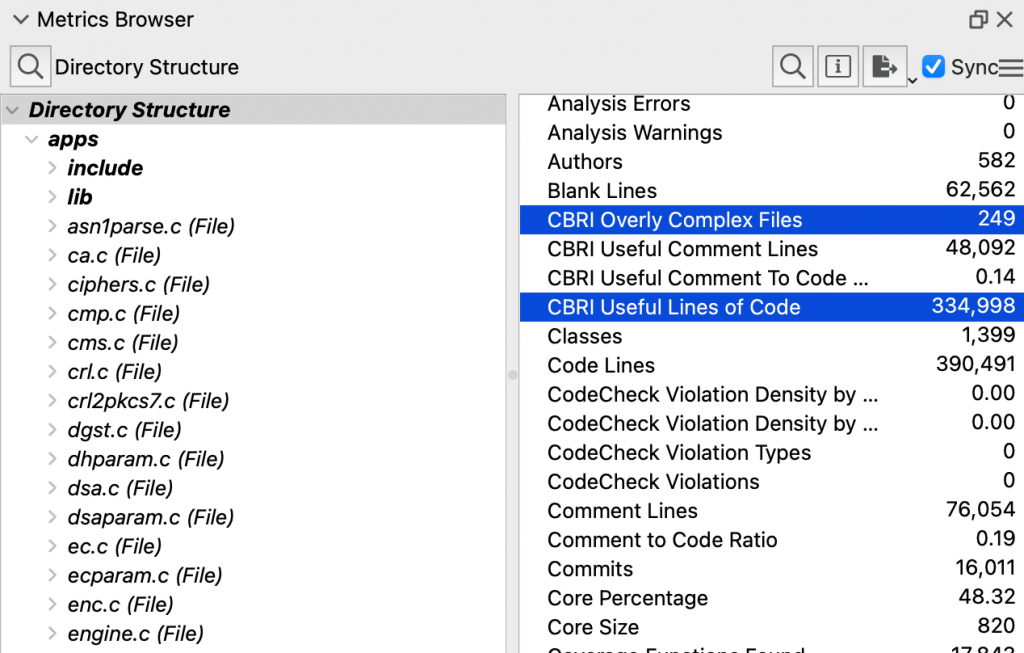
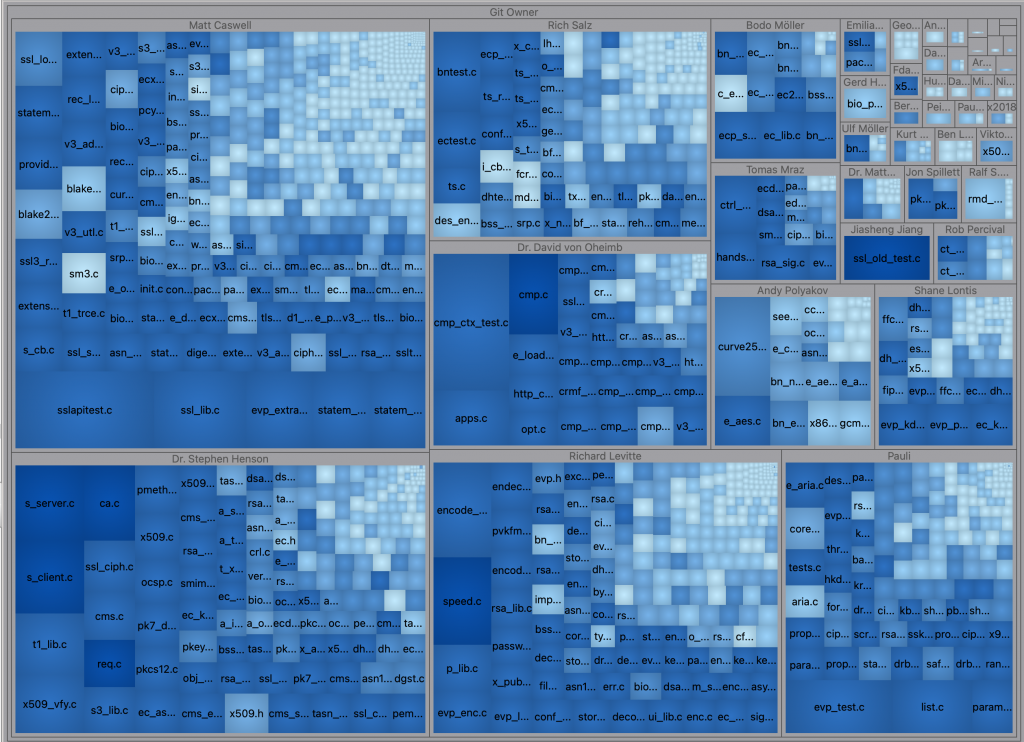
Since the metrics plugin makes them true metrics, I can use them outside the Metrics Browser as well. For example, I can make a treemap grouped by the Git Owner architecture sized by number of statements and colored by the number of complexity thresholds exceeded.
Other Metrics
There are two remaining metrics that contribute to CBR Insight scores: duplicate lines of code and comment to code ratio.
Duplicate Lines of Code
There is a Perl interactive report for finding duplicated lines of code. The CBR Insight plugin probably incorporated a version of that script, and modified it to only consider useful lines of code. I’m not going to include it in my metric plugin for three reasons.
- It has to scan the entire database which makes it slow, at least for the first call. So if I do a metric plugin for it, it will be in a separate script so users don’t have to install it with the others.
- It’s hard to convert the Perl into Python (the CodeCheck team already tried that).
- I don’t think the value is correct for overlapping duplicates. As an example of overlapping duplicates, consider the strings “ABCDE”, “ABCDE”, and “ABC”. All three duplicate the prefix “ABC” but the first two continue overlapping for “DE” as well. In this case, I think the metric value reported by the CBR Insight is too high.
So, duplicate lines of code will have to wait for a future script.
Comment to Code Ratio
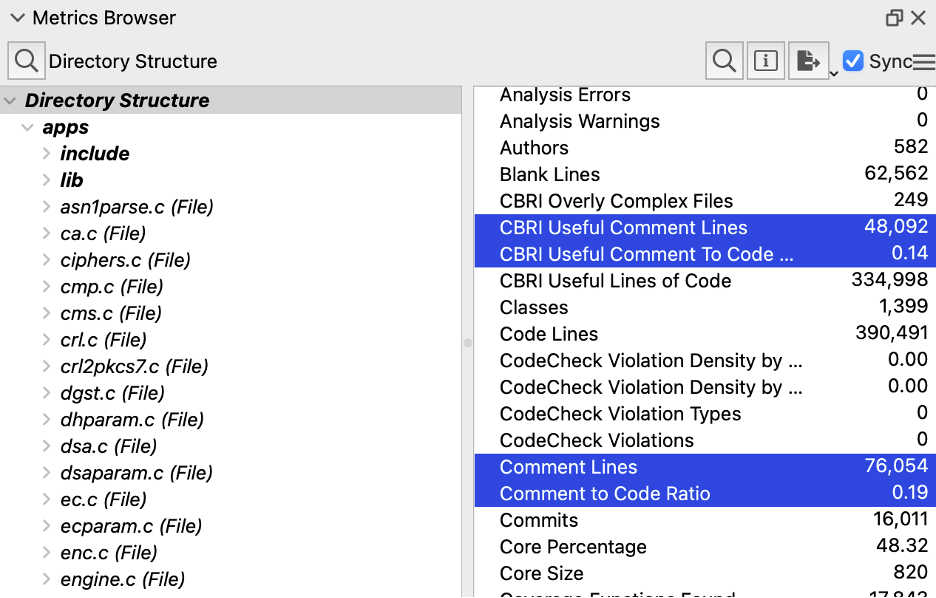
Understand has a built-in metric “Comment to Code Ratio” (RatioCommentToCode). However, like lines of code, CBR Insight modifies the metric a bit to remove “useless” comments. A comment is useless (for clarity at least) if it is a copyright or licensing notice or if it appears to be commented out code.
For a file, CBR Insight‘s useful comment to code ratio is the useful comments divided by Understand’s “Code Lines”. For the project, the useful comments are divided by the useful lines of code. In my metric plugin, both files and architectures divide by the useful lines of code to be consistent with each other.
To be honest, like the duplicated code, the commented out code detection in Perl was pretty complicated. So there’s a high probability that my metric plugin won’t quite match the CBR Insight plugin. The metric plugin also doesn’t try to group consecutive single line comments together like the CBR Insight plugin does. But, in my quick glance, it seemed to be in the right ballpark. The metric output by the CBR Insight plugin was 13.60% and the metric from the plugin is 14% compared to the 19% original comment to code ratio.
Conclusion
This article covers a lot of metrics defined by CBR Insight. Of course, to see how your project compares, I’d use CBR Insight directly. But if you want to explore the metrics in Understand, try out the metric plugin. Or check out our plugin repository for more cool plugins.


