Abstract: Understand 7.0’s new Interactive Reports transform raw code metrics into insightful and engaging visualizations, offering customization options to tailor the analysis to your specific needs and reveal the true story behind your code.
I want my code to be better this year. Great! What does “better” mean? In order to track my progress, I need a way to measure my code. That’s where Understand’s Metrics come in. Understand comes with many built-in metrics ranging from a simple line count to cyclomatic complexity.
However, numbers alone wouldn’t keep me on task. The problem is presentation. I can know with all my heart that eating vegetables is good for me but until they’re presented as a salad or other dish, I’m not eating them. That’s where Understand 7.0’s new interactive reports come in. They’re the ‘delicious dishes’ that make your code metrics both insightful and engaging – and just like a good chef, you can customize these ‘dishes’ to your liking. In this article, we’ll explore how these customizable reports, including how to write your own plugins to tailor them to your exact needs, can help you visualize and understand your code, going beyond raw numbers to reveal the true story behind your metrics.
Ingredient Inspiration
As mentioned above, for this article I’m a little more interested in presentation than the contents. So I’m going to take my inspiration for contents from some existing Understand views. Let’s take a minute to visit all of the existing metrics reports and views in Understand:
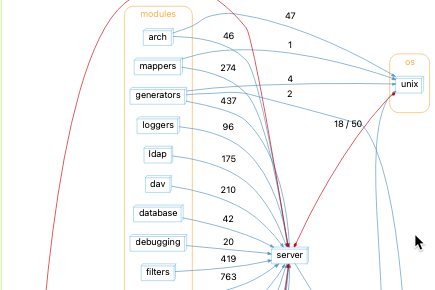
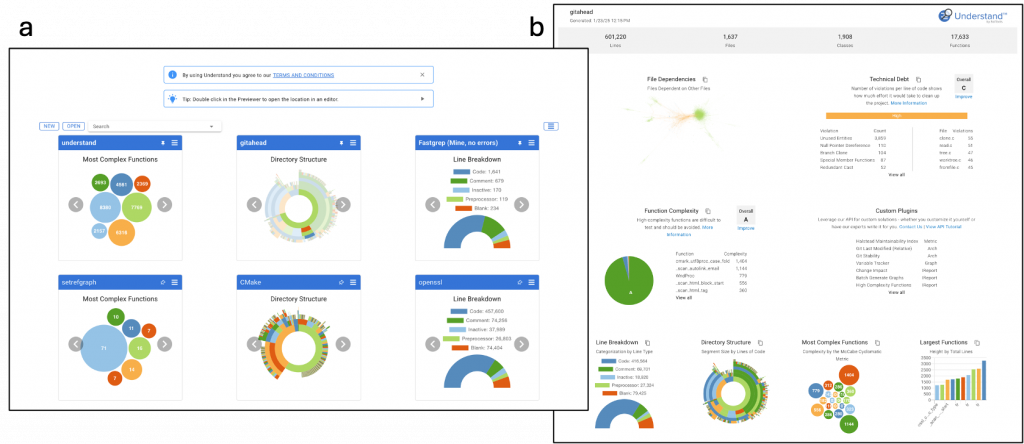
The most obvious metrics view is the Welcome Page with its Line Breakdown Chart, Most Complex Functions Chart, and Directory Structure by Lines of Code Chart. The Project Home page extends these with more charts, many related to lines of code and complexity.
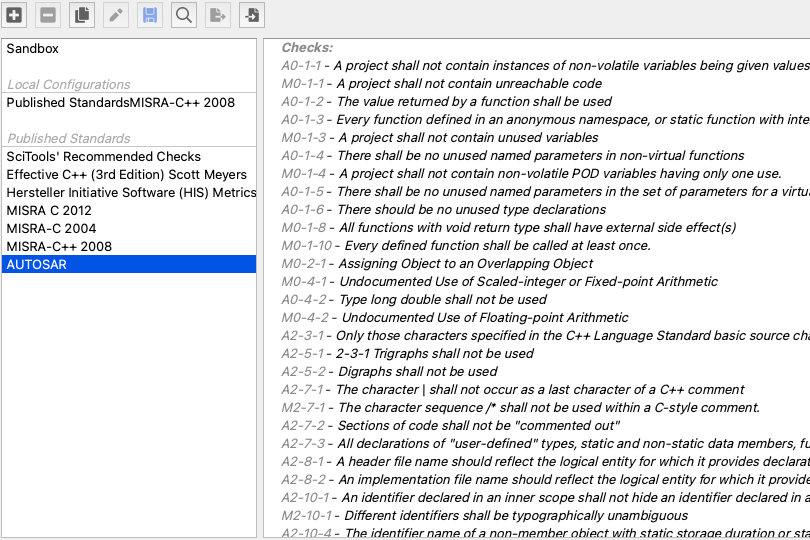
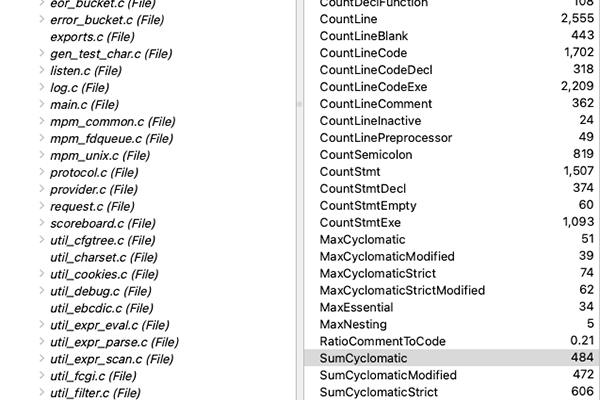
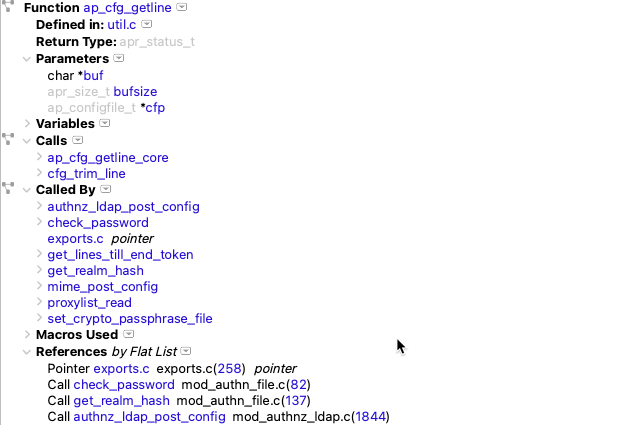
Moving on past the default pages, the most visible views of metrics are the Metrics Browser and the Metrics CSV Export, both accessible from the top-level Metrics menu. There’s also a slightly less visible Metrics HTML Export accessible from the Metrics Browser. All three of these views are comprehensive, showing all the built-in metrics you’ve turned on in Project Config and all the metric plugins you’ve enabled.
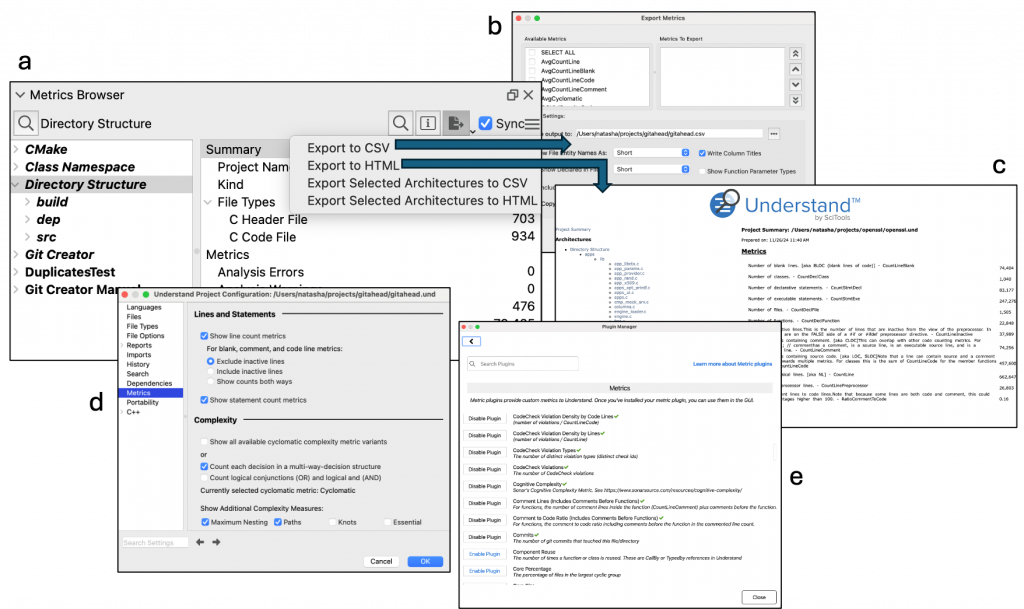
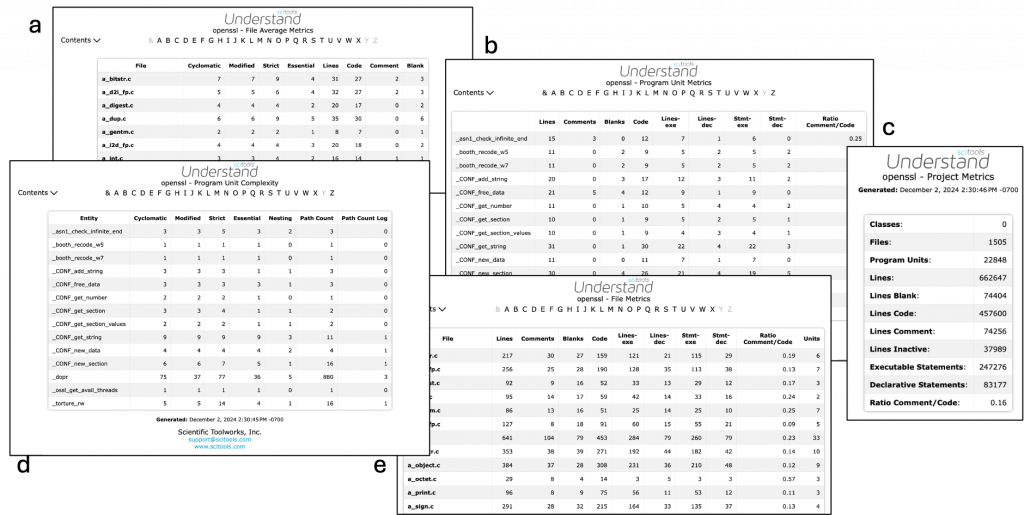
Finally, moving onto more obscure metrics views, there are metric tables in the classic reports. These reports, despite showing their age, are popular enough to continue resurfacing in the application despite repeated attempts to remove or replace them. The Overview page of the html reports has metric charts that are an earlier version of the charts shown on the Project Home page. There are also five metric reports, at least for my OpenSSL project.
Line Metrics Report Plugin
Source Lines of Code(SLOC) and other line counting metrics are a great starting point for my first new plugin. They relate to time, cost, and even hint at code quality. Here’s why I start with line counting metrics:
- Lines -> time -> money. The more lines there are, the more time I expect to spend to understand, change, use, or fix the code. And time, of course, is money.
- Lines bring meaning to architectures (groups). Understand lets you group your code into architectures. For example, Understand can group your code by license using an automatic architecture plugin. But the architecture itself isn’t very useful to me until I can use it to know how much of my project belongs to each license type. Line metrics answer that question.
- Lines hint at quality. A super long function or super long file is likely to be difficult to comprehend. The ratio of comment to code is also related to quality.
So, how can I present line metrics? I’ll take some pieces from the existing displays in Understand:
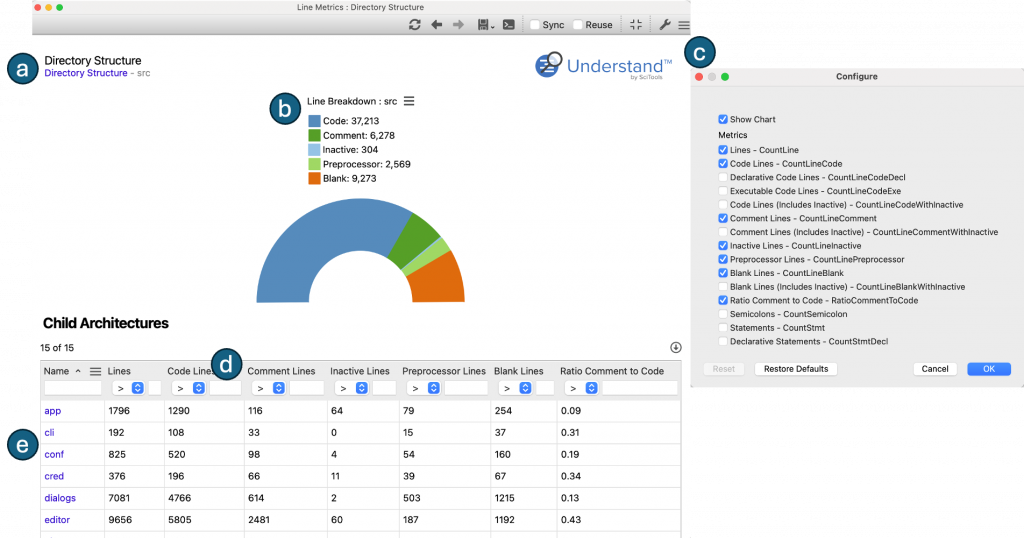
- Chart – I like the Line Breakdown Chart from the Welcome Page and Project Home Page. It gives a fast, graphical overview.
- Tables – I like the table view of the classic reports to view line details. And interactive report tables can be even cooler with the addition of filters.
- Hierarchy – I like the idea of being able to dig deeper into a point of an interest. So, the tree structure of the Metrics HTML Export is a useful structure. But, it takes up too much space and shows too much information. So, interactive reports were built with a breadcrumb system of pages in mind, inspired by lcov coverage reports.
The resulting Line Metric Interactive Report plugin can be run on any architecture (or file or the project as a whole), shows the line breakdown chart for the current level, shows a table showing all the children and their values, and navigates the architecture hierarchy using the child names in the table to dig deeper and the breadcrumbs at the top to return. You can enable these new report in the Plugin Manager in Understand.
Complexity Metrics
The next most used metrics are complexity metrics. Cyclomatic complexity is used to see how hard code is to test. The more decision points, the more test cases must be written to exercise them all. More decision points can also make code harder to understand and maintain. So, the McCabe Cyclomatic Complexity comes with recommended thresholds, and standards like Hersteller Initiative Software (HIS) Metrics also recommend thresholds.
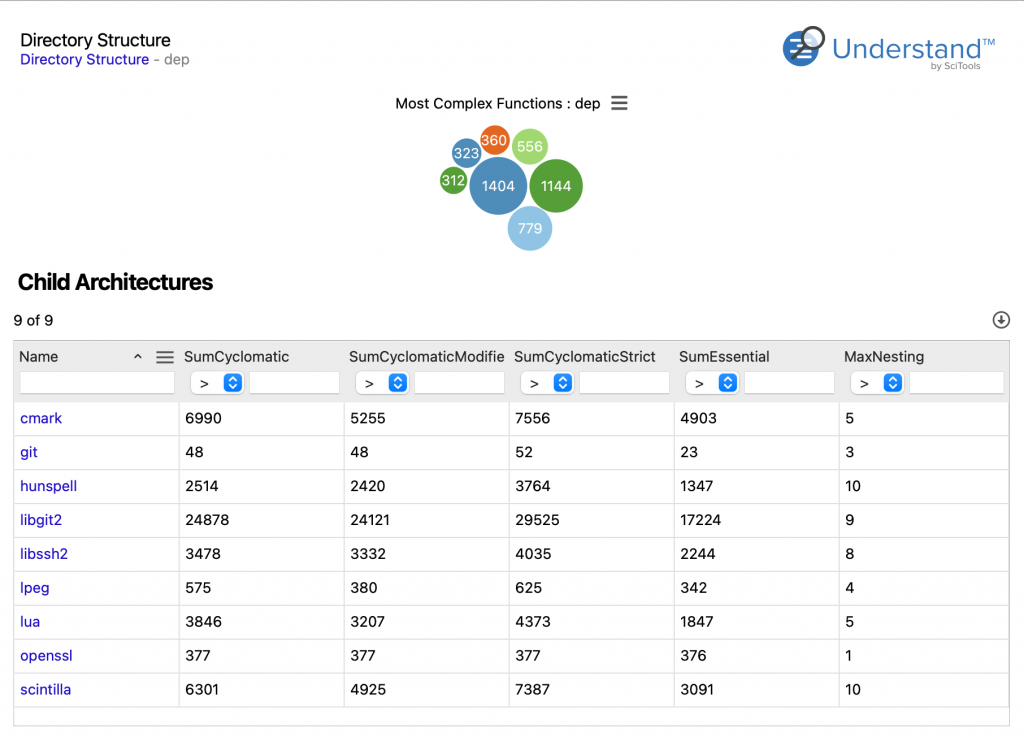
The great thing about interactive reports is that python plugins can be easily customized. So, I can take my Line Metrics report and make a few tweaks to make it into a complexity report instead. First, I’ll swap out the line breakdown chart for the “Most Complex Functions” chart from the Welcome Page and Home Page.
Then, I’ll swap out the function line metrics with function complexity metrics, including the Cognitive Complexity metric plugin because I think it’s cool. Finally, I’ll swap out the file and architecture metrics, but complexity metrics don’t have the same names for files and architectures line line metrics did. Files and Architectures can report the maximum, sum, or average of the complexity values for the functions in them. I’ll default to the sum.
Other Reports
Well, this is fun. What report should I make next? At this point I’ve incorporated all the information in three of the classic reports and two thirds of the welcome page charts. I could make the equivalent of the Metrics CSV Export or the Metrics Html Report. I’d just have to take one of my previous two interactive reports and add every possible metric to them. But that sounds overwhelming and ugly.
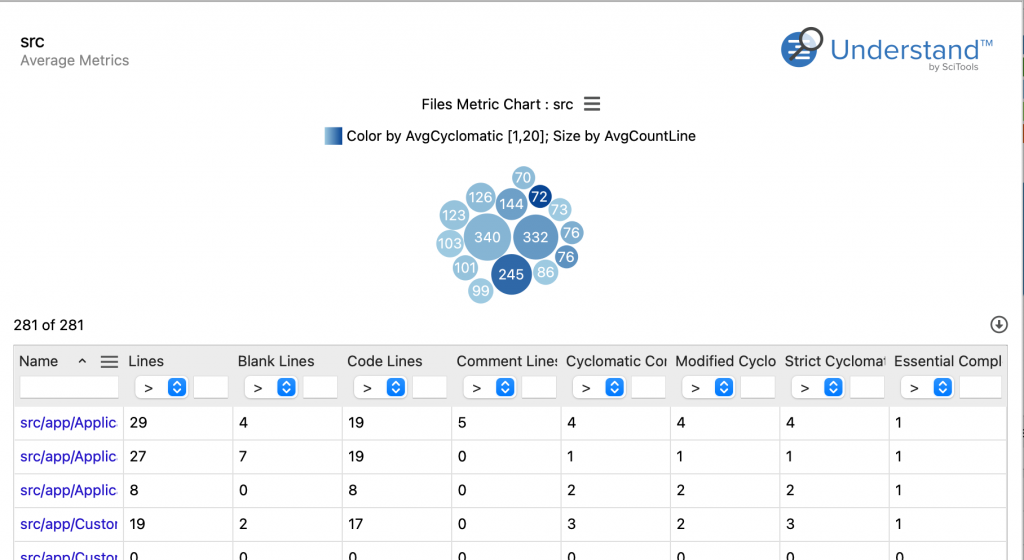
So, I’ll do the metrics from the “File Averages” report. The metrics are a mix of complexity and line metrics so they’re already available from the two previous reports. But someone must have thought they’d be cool together at one point. That makes my table, but what should I do for a chart? I haven’t done a 2-metric chart yet, so let’s try one of those. I’ll make the size by AvgCountLine and the color by AvgCyclomatic and leave the layout as flat bubble since I like the contrast of circles with the square table below.
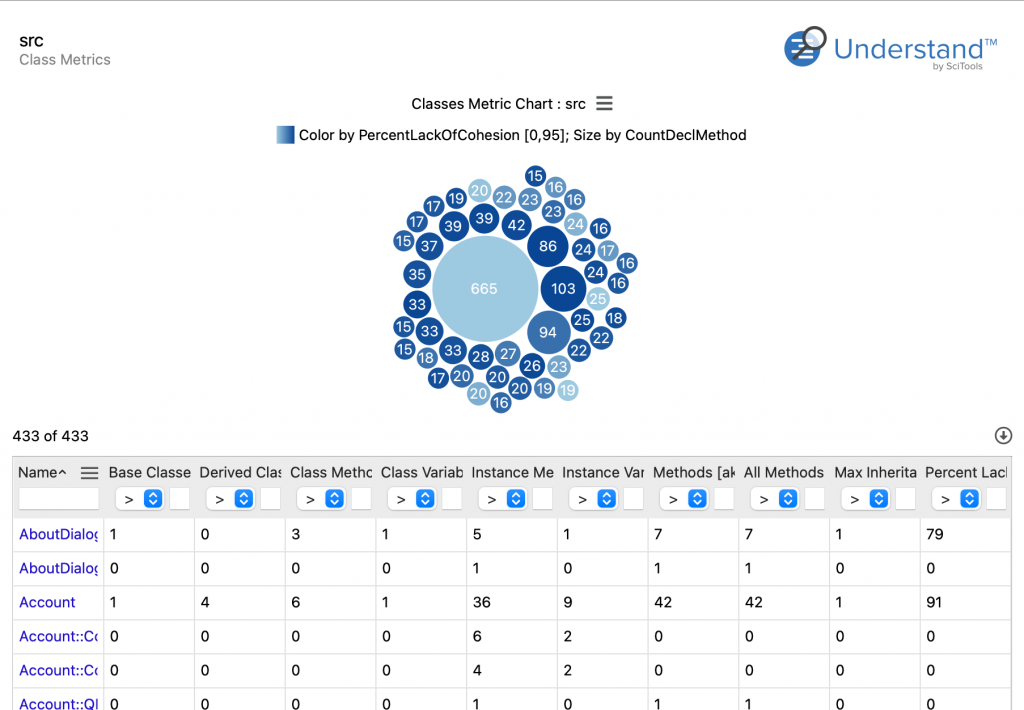
It doesn’t seem necessary to recreate the Project Metrics since that’s basically what the Project Home Page is. So, I’m out of inspiration from classic reports. Looking over built-in Understand metrics, the main metrics I’m missing are class metrics. So, I’ll make one of those.
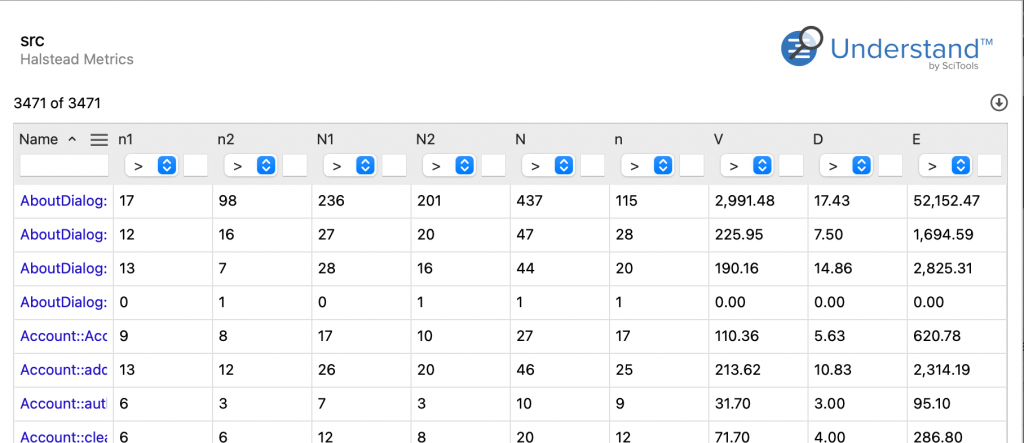
What about plugin metrics? There’s a script for exporting Halstead metrics as a csv. But most of the metrics in the export aren’t Understand metrics. Only the Halstead Volume has a metric plugin. Well, not anymore. I’ll just add the missing ones as metric plugins too. I love plugins!
Conclusion
Understand’s built-in metric views are great starting places to explore metrics. But the true fun and power comes from customization. Pick the metrics you want, for the entities you want, displayed your way. Don’t limit yourself to csv data exports or aging html reports. Take advantage of interactive reports to get your data, your way, complete with charts, tables, multiple pages, and synchronization with other Understand views.