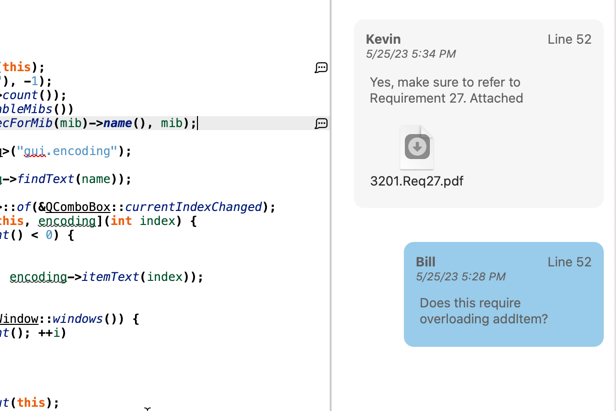
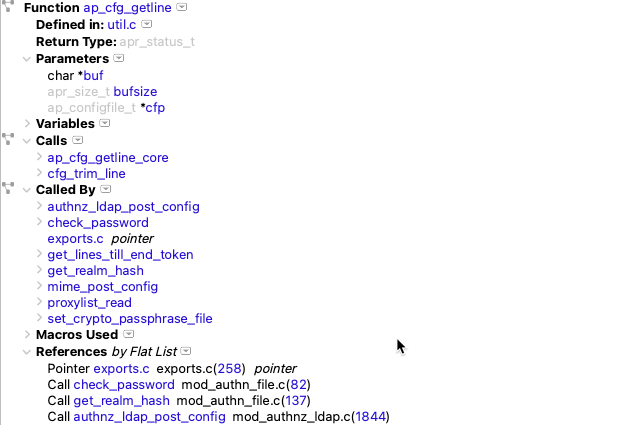
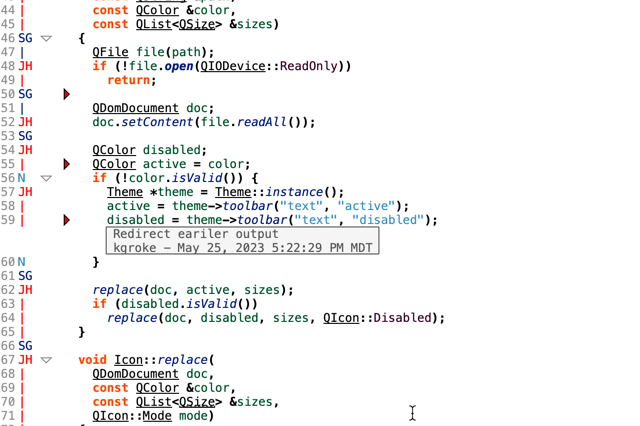
Abstract: The newest features of Understand 6.3 help you better understand your code and avoid coding bugs. Highlights of the release include the following:
- Understand data flows between architectures using new Data Flow Diagrams
- Know exactly what lines/statements affect variable states with the Variable Tracker Graph
- Demystify graphs using colors, symbols, and shapes
- Kill bugs as you add them via continuous CodeCheck verification
- Prioritize just the bugs you worry about with a customizable Violation Browser
- Write automated dependency rules to work with the code in your project
- Easily create architectures that are automatically updated every time you open your project in Understand
- Verify your code against AUTOSAR industry standards using AUTOSAR support
- Catch mistakes and misspellings using the new Spell Checking feature for comments/strings
- Solve other code checkers reported bugs quicker using the new SARIF Imports feature
- Verify your code against the C# 11 coding language
- Explore new metric changes using our newest metric–CyclomaticStrictModified
- Run Understand from Jenkins to create and analyze projects, inspect your code for violations, and export valuable metrics about your code
These improvements aim to provide users of Understand with the best static code analysis experience possible.
The Understand 6.3 release highlights the tools’ newest features and upgrades. Some of these improvements enhance existing tools, while others offer brand-new capabilities. In addition, many of these improvements come in response to customer inquiries–we utilize your feedback to create a tool that caters to your needs. With that, we’re excited to introduce Understand 6.3!
Graph Customization
Data visualization is a great way to interpret data. In Understand 6.3, we’ve added data flow and variable tracker graphs, and in addition, we have added metrics overlays to enhance already dynamic features. Here’s a deep dive into the characteristics of each of these graphs.
Data Flow Graphs
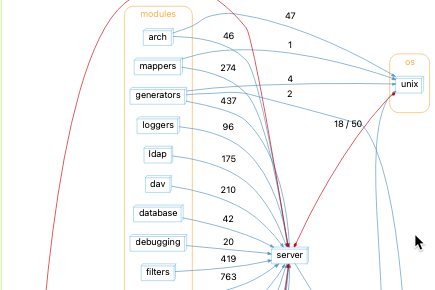
Data Flow Diagrams (DFDs) graphically represent data flow within a system. They are used to visualize how data is processed, from entry points to exit points and to identify the system’s inputs, outputs, and transformations. They visually represent the system’s structure and the relationships between data and processes. DFDs are helpful for system analysis, process improvement, and identifying potential error areas. They are also beneficial in developing new systems and improving existing systems.
Our Data Flow Diagrams allow you to visualize what functions and objects interact with a given entity. We have two Data Flow Diagrams in Understand that enable you to see how data flows into an object and how data flows out. They are named Data Flow In and Data Flow Out, respectively.
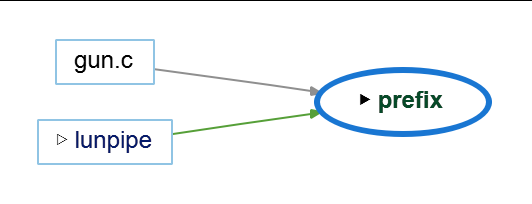
This simple example shows the Data Flow In graph for the global object prefix from the zlib open-source project.
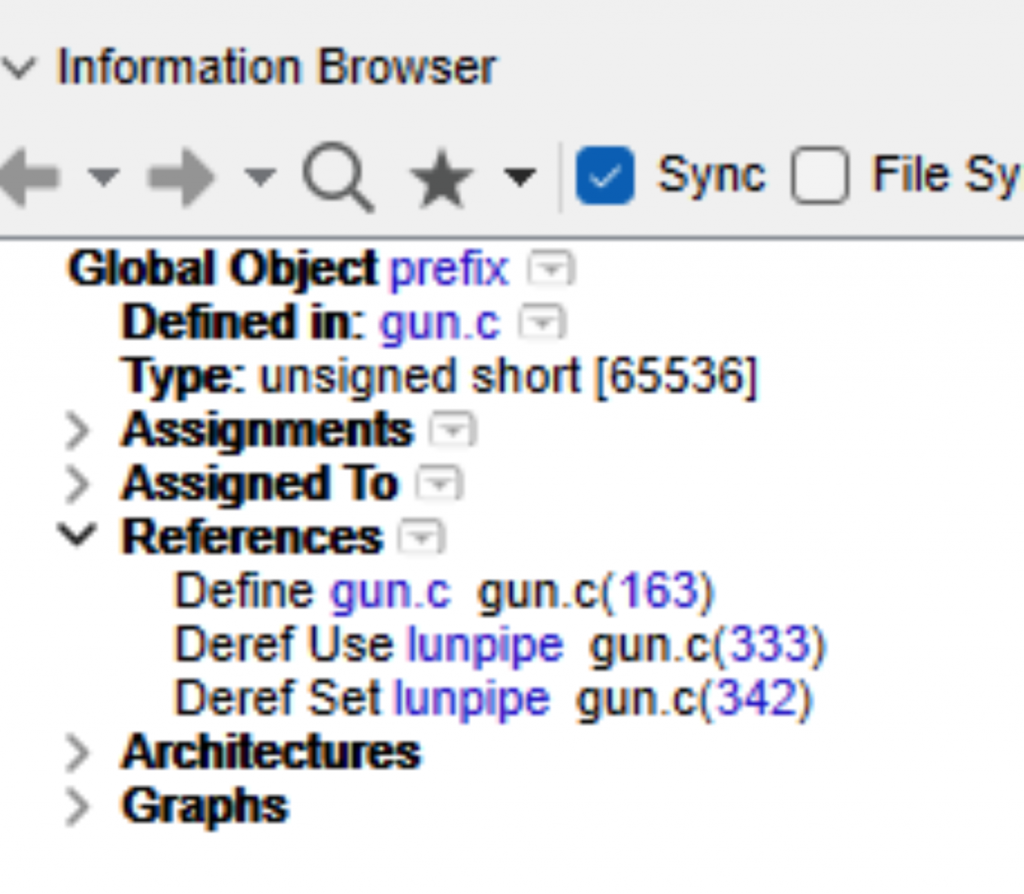
The Information Browser shows only two locations where prefix has data flowing into it–once where it is defined and once where it is set.
On the other hand, it is only used once, so the data flow out of it is pretty simple at first.
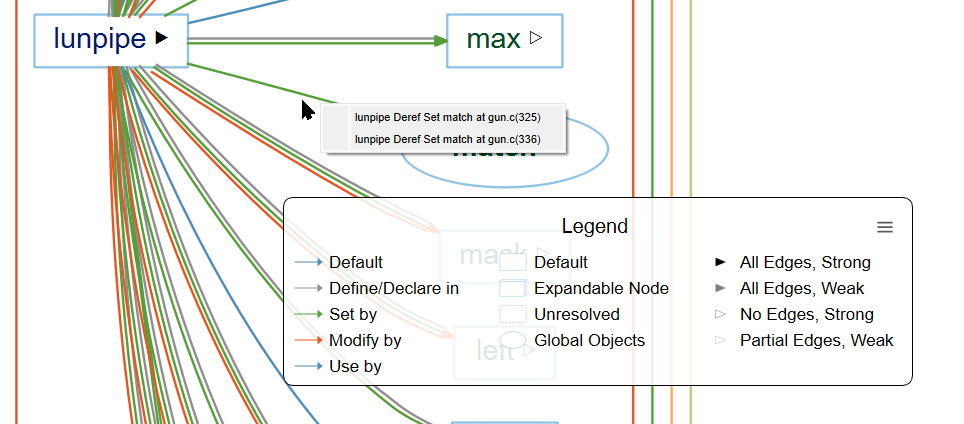
However, lunpipe has much more data flowing out of it, including a recursive use of prefix, so the dataflow out at two levels is quite a bit more complicated. For clarity, switch to the clustered version of the graph, which groups each entity in the corresponding files and architectures.
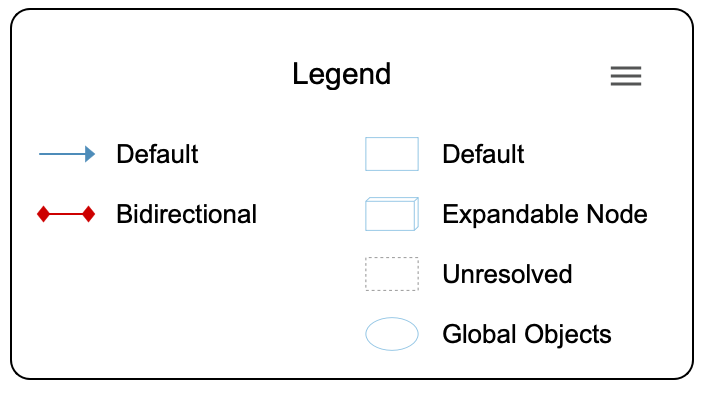
Right-click on any edges to view and jump to the references they represent. The legend shows that each colored line is a different reference kind and that the shapes indicate different entity kinds.
Variable Tracker Graph
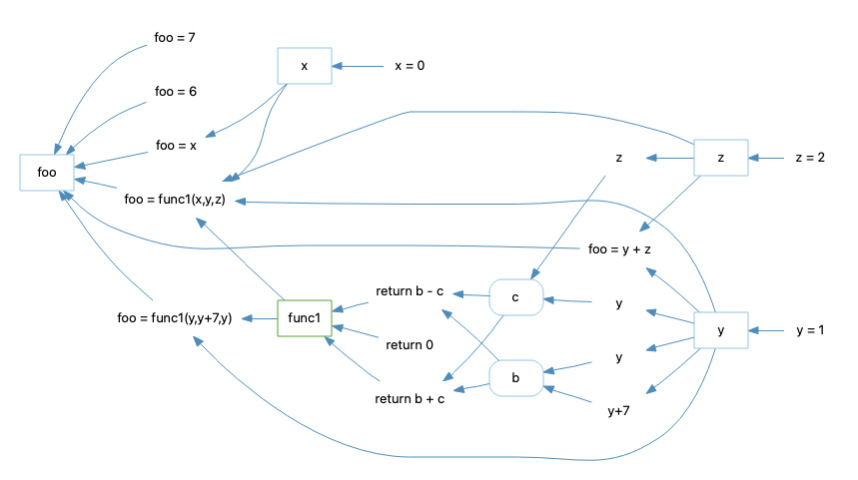
A Variable Tracker graph tracks down bugs in your code by exploring all of the possible assignment states. A vital component of an effective Variable Tracker graph is the Information Browser. Here, all of the information related to the variable is displayed. Creating a visual representation of this information in the form of a graph makes it easy to see where the bug is occurring.
Customization and Metrics Overlays
Understand offers a diverse range of graphs. We’ve even made a video highlighting such variety. To better understand these graphs, it’s helpful to utilize the legend associated with particular graphs. Access the legend by selecting the icon shown below.

Once the icon is selected, a legend will appear.
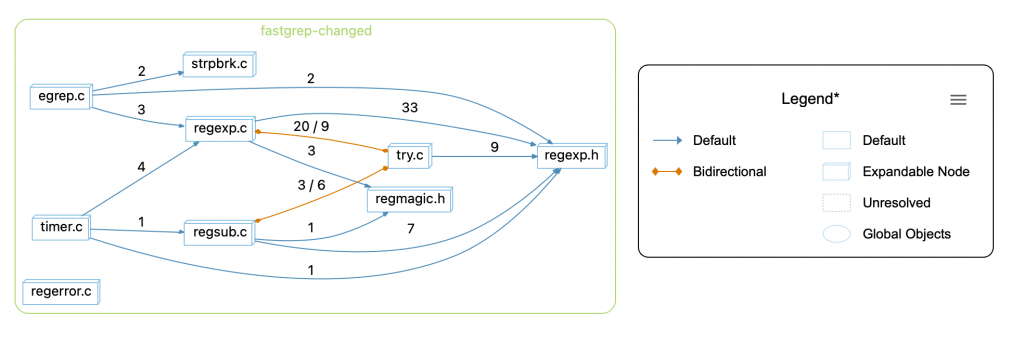
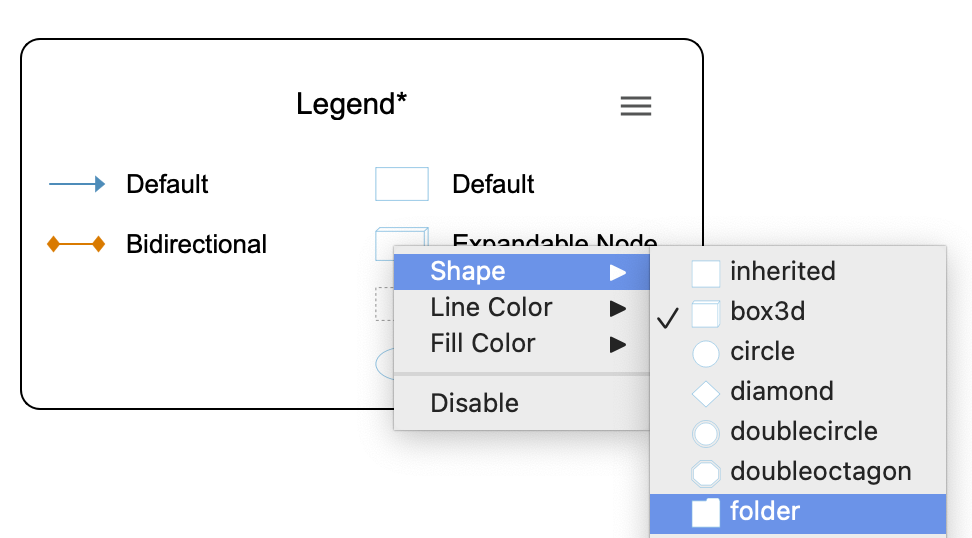
Right-clicking on a piece of information in the legend allows the user to customize that data. For example, the user can change its color by right-clicking Bidirectional in the legend above.
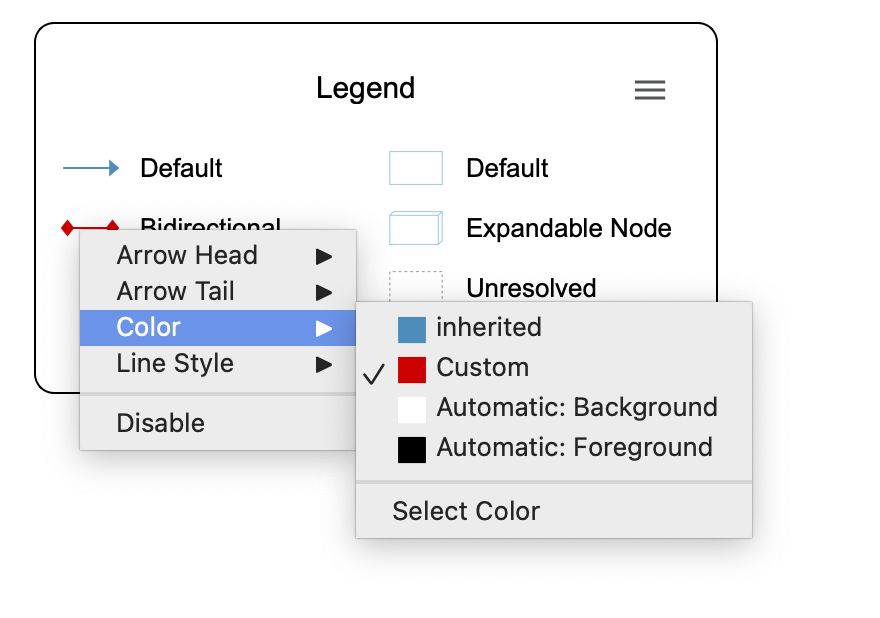
There are a few pre-built colors to select from. The graph looks like this by selecting the color orange for Bidirectional arrows.
Nodes are also customizable in Understand 6.3. For example, try changing the shape of a node from box3d to folder. Here is the result.
If you don’t like a particular customization style, simply disable it. Disabling a style won’t completely delete it, but it will no longer appear as a customization option. This style may be re-enabled at any point.
Other customizable options in Understand 6.3 include node and edge style variations and the ability to add a metric color scale to your graph. Check out how to use these customization options and how to save, import, and export your styles here.
Continuous CodeCheck Verification
CodeCheck is one of the most popular features of Understand. While CodeCheck already runs automatically, Understand 6.3 takes it to the next level by verifying your code each time you save a file. All violations are shown inline, right where you are working, so you have the chance to quickly fix it or accept it.
Customizable Violation Browser
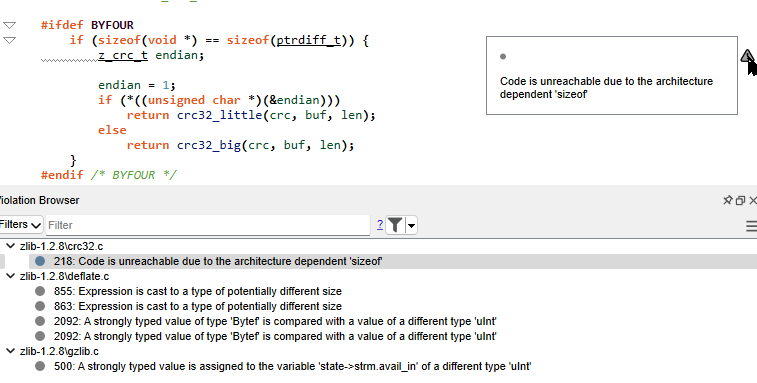
Understand 6.3 features a customizable Violation Browser that displays all of the violations in your code at the file, directory, or project level. From here, you have the power to filter, so you can quickly find the most egregious violations, find all of the violations in a specific directory, or a combination of both.
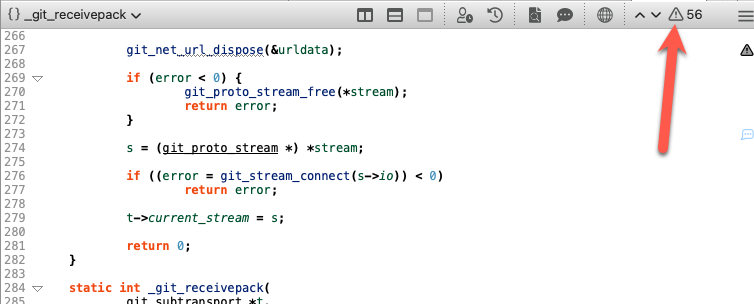
Click the warning icon to view all warning and analysis errors in the Violation Browser.
Use the filter dropdown to customize which violations you see.

Automated Dependency Rules
Understand allows you to write your own custom dependency rules, and now, with Understand 6.3 these rules can be automated. Any dependency rule that you create will be displayed each time you open the project. So, instead of constantly thinking about what your code should look like, you can see what your code actually looks like.
To see how our team uses Automated Dependency Rules on Understand code, take a look at this post showing a rule that no API code should rely on User Interface (UI) code: Automated Dependency Rule.
Automatic Architectures
Automatic architecture plugins are Python scripts that run every time you open your Understand project. They allow you to create architectures easily and are automatically updated.
Our experts have put together a few ideas of how you might use this:
- Query version control to make an architecture of your most often modified files to identify churn
- Automatically partition your files based on folder structure or file names
- Make an architecture that quickly separates 3rd party libraries from your team’s code
This article provides a more comprehensive explanation of how to use these plugins.
AUTOSAR Support
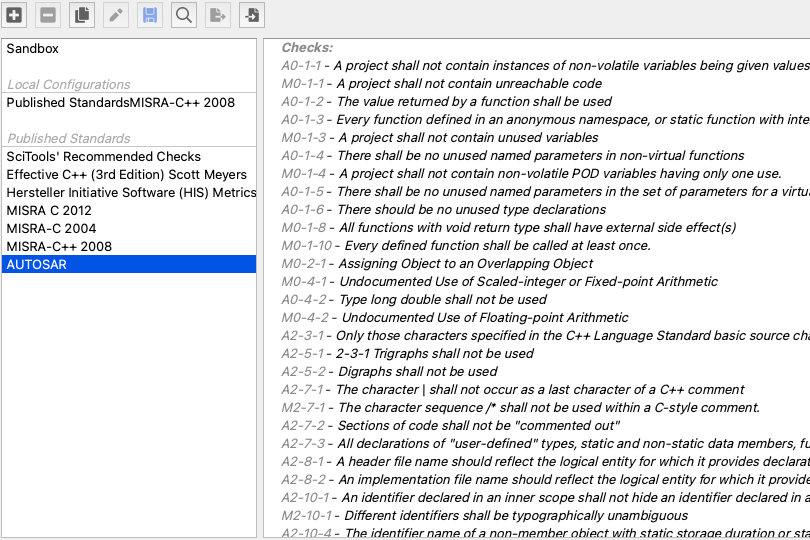
Many of our customers in the automotive industry require compliance with AUTOSAR standards. We’re excited to add AUTOSAR to our list of standards that Understand’s CodeCheck feature supports.
Understand uses static analysis checkers for 94% of AUTOSAR checks that can be automated, which is one of the best rates in the industry.
Learn more about AUTOSAR here.
Spell Checking
Understand 6.3 now offers spell checking for comments and strings in your code. This feature functions in the same way as most common word processing programs, that is, by adding a wavy red line beneath the misspelled word. It also includes a dictionary feature, allowing you to add commonly used or misidentified words to your personal vocabulary list. We realize that many entity names are not names found in the dictionary or they are a mash of multiple words. Because of this, we recognize all of the entity names in the project and don’t identify them as misspellings in your strings or comments.
Here is what you can expect this feature to look like on your screen.
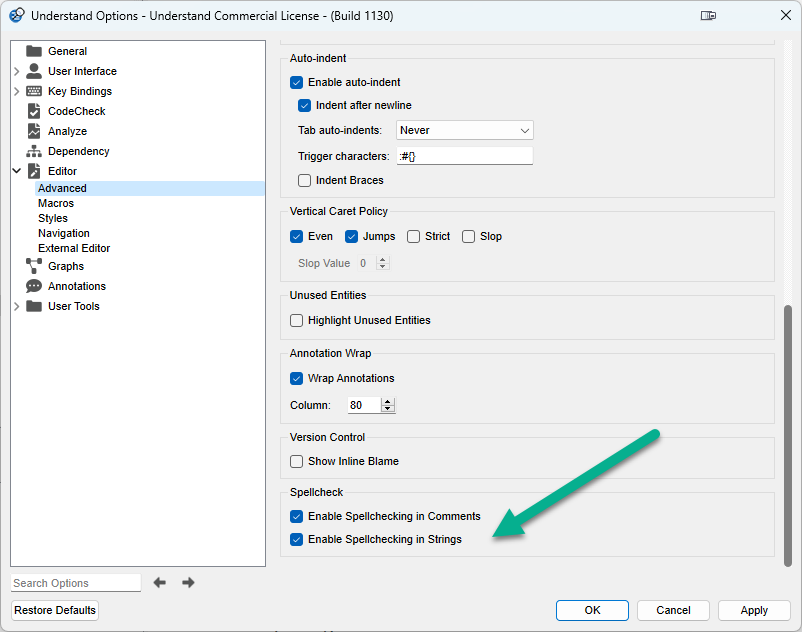
There are a few spell check options that let you turn spell check off/on for comments or strings. You can find the options in Tools->Options (or under Preferences on Mac). Select Editor->Advanced, and look for the Spellcheck section at the bottom.
SARIF Imports
Understand communicates with other static analysis tools by importing information saved as SARIF (Static Analysis Results Interchange Format) files. For example, if you use another tool to identify code violations, then Understand can use the imported data to investigate and find solutions to those violations.
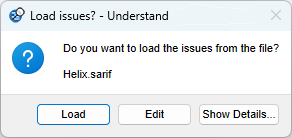
Importing results from other static analysis tools is as simple as dropping the SARIF export file into the Understand editor.
These imports will be found in the Violation Browser and displayed on the right-hand side of your editor for open files.
C#11 Support
Understand 6.3 includes the latest version of the C# language.
Metrics Changes
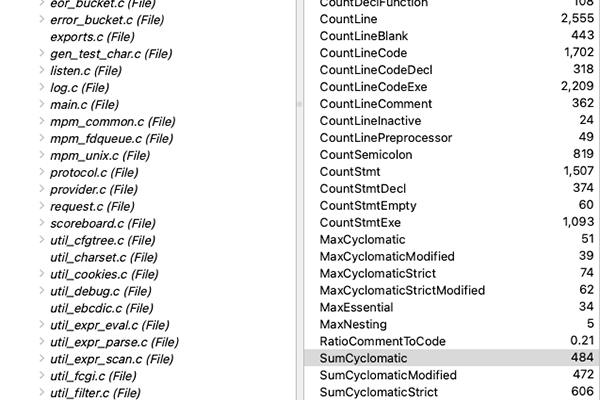
Understand 6.3 includes a new metric–CyclomaticStrictModified. We’ve also made a minor change in how the Cyclomatic Complexity metric is calculated with the C++ Strict Parser. As a result, it is now more accurate and consistent with other languages. We’ve included more details about this in our Build Notes.
Jenkins Plugin
Our new Jenkins plugin provides an easy interface to run Understand from Jenkins. This feature allows for creating and analyzing projects, inspecting your code for violations, and exporting valuable metrics about your code. In addition, violations can quickly be sent to Warnings Next Generation for easy reporting and issue tracking.
Enjoy the Latest Version of Understand
That’s a lot of information, and we didn’t even cover it all! Now that you have a better idea of what Understand 6.3 has to offer, we encourage you to explore the tool yourself. If you have any questions or feedback about the latest version of Understand, our experts are always standing by and eager to assist.
We believe Understand is the best static analysis tool to analyze your code. But don’t take our word for it–try Understand yourself for free!
You can access our full release notes here.
Happy coding!


