Abstract: Learn what’s changed with Metrics in Understand 6.4.
What happened to metric …!?!? If you don’t see your favorite metric right away, don’t panic. Understand 6.4 made some changes to metrics, but they’re all still available.
Focus on YOUR metrics
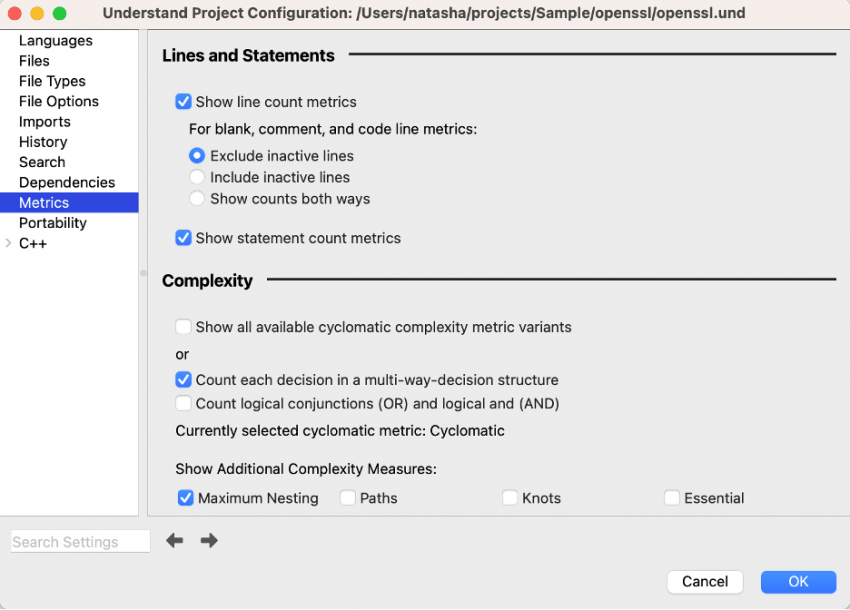
Have you ever had a hard time finding a metric because there are so many metrics available? Understand 6.4 focuses on the metrics that matter to you. Go to Project -> Configure, and select the Metrics page:

If your metric is missing, the first place to check is this page. Some metrics, like the variations of Cyclomatic Complexity, are hidden by default.
What if my scripts use a metric that’s not visible? Don’t worry. The metrics configuration page only affects which metrics you see in the GUI. The API can still access any metric.
Access Comparison Metrics Anywhere
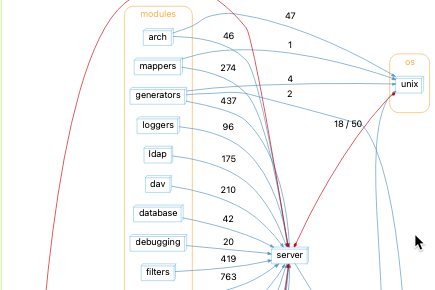
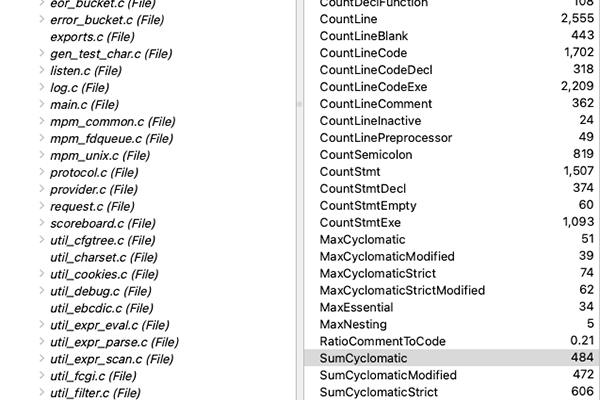
The Changed Entity Locator and Changes Treemap had some valuable numbers like the percentage changed or number of new lines. Now all comparison metrics are true metrics. That means you can use them to color your graph or see them in the metric browser. Note that comparison metrics are only available when a comparison project has been used. Ways to use a comparison project include locating changed entities, opening a changes treemap, or opening a comparison graph.
Create Custom Metrics
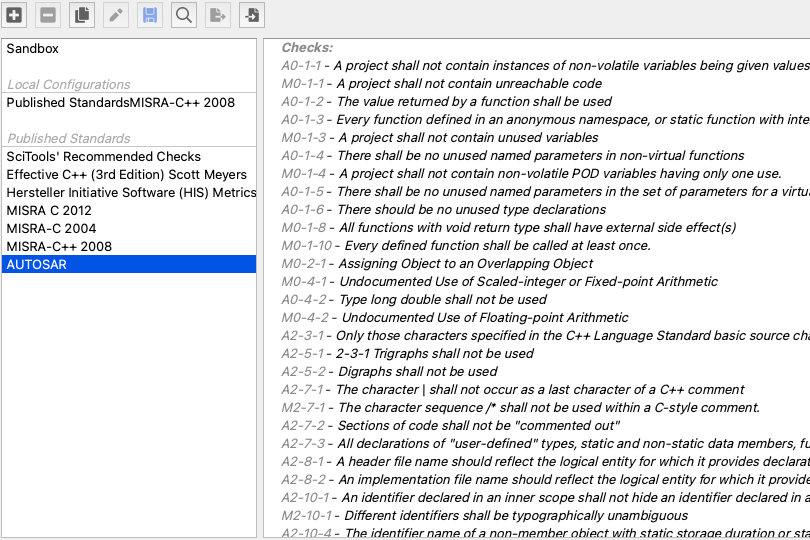
What about the metrics in a CodeCheck treemap? Can I show those in the entity locator or use them in graphs? With Understand 6.4, the Perl and Python APIs can access violations for file entities. The violations even include analysis errors. So, if you’re interested in CodeCheck metrics, try this metric plugin with the same metrics that appear in the CodeCheck Treemap. This metric plugin for analysis errors and warnings is also helpful. You can learn more about creating your own metric plugins here.
Other Updates
Over time, Understand metric IDs have become a little inconsistent. For example, blank C lines that include inactive code were AltCountLineBlank, but blank HTML lines were CountLineBlank_Html. As part of Understand 6.4, we updated IDs to be more consistent.
What if your scripts still use the original IDs? With the new ability to create your own custom metrics, you can install this plugin to map the old IDs to the new IDs. There’s also a list of ID changes at the end of this article.
Understand 6.4 also updated the metric documentation. Ever wished the pictures were higher resolution? I have. Understand 6.4 has new pictures for all metrics. Same great content, better resolution. The documentation and GUI also match, with the same detailed descriptions from the documentation available in graphical user interface tooltips, and the metric names instead of metric IDs shown in most areas of the GUI.
Here’s a table of the name changes.
| Original Metric ID | New Metric ID |
| AltCountLineBlank | CountLineBlankWithInactive |
| AltCountLineCode | CountLineCodeWithInactive |
| AltCountLineComment | CountLineCommentWithInactive |
| CountLineBlank_Html | CountLineBlankHtml |
| CountLineBlank_Javascript | CountLineBlankJavascript |
| CountLineBlank_Php | CountLineBlankPhp |
| CountLineCode_Javascript | CountLineCodeJavascript |
| CountLineCode_Php | CountLineCodePhp |
| CountLineComment_Html | CountLineCommentHtml |
| CountLineComment_Javascript | CountLineCommentJavascript |
| CountLineComment_Php | CountLineCommentPhp |
| CountLine_Html | CountLineHtml |
| CountLine_Javascript | CountLineJavascript |
| CountLine_Php | CountLinePhp |
| AltAvgLineBlank | AvgCountLineBlankWithInactive |
| AltAvgLineCode | AvgCountLineCodeWithInactive |
| AltAvgLineComment | AvgCountLineCommentWithInactive |
| AvgLine | AvgCountLine |
| AvgLineBlank | AvgCountLineBlank |
| AvgLineCode | AvgCountLineCode |
| AvgLineComment | AvgCountLineComment |
| CountStmtDecl_Javascript | CountStmtDeclJavascript |
| CountStmtDecl_Php | CountStmtDeclPhp |
| CountStmtExe_Javascript | CountStmtExeJavascript |
| CountStmtExe_Php | CountStmtExePhp |

