TLDR
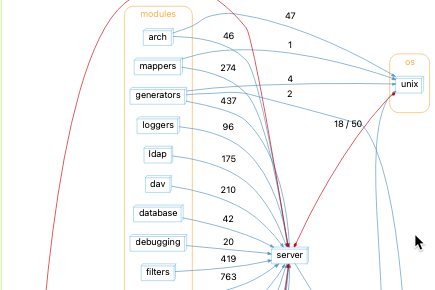
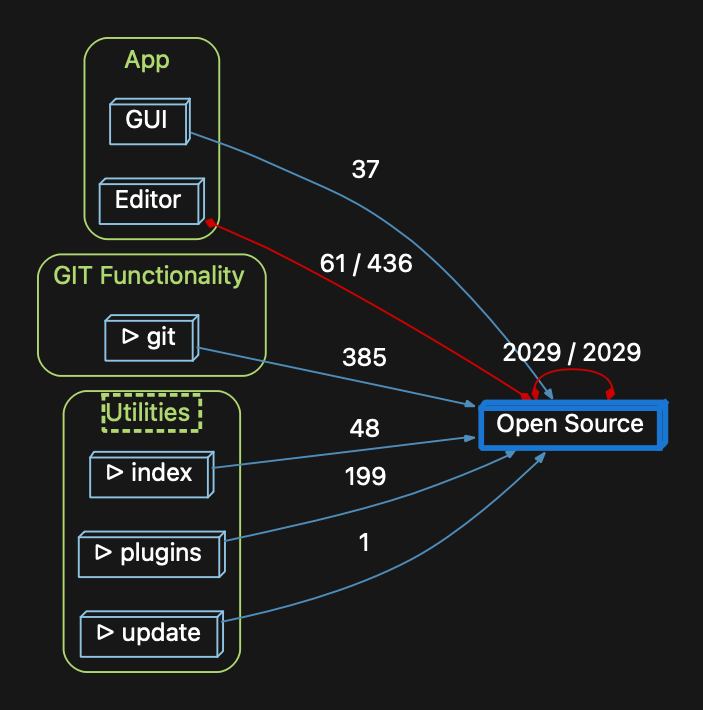
Using Architectures + Dependency Graphs, I was able to make the above graph in about 5 minutes. I now know what parts of my project depend on open source and how strong those dependencies are.
Details
I’m using our GitAhead sample project, if you want to follow along.
Step 1: Make an Architecture
I’ll make an architecture where I create sections of my code that describe functionality–like GUI, App, Database, and so forth. Then I’ll find code with an open source license and drop it into an architecture called “Open Source.”
This took me about 5 minutes and some Find In Files exploration looking for Open Source licenses. Once found, I dropped their source directory into the Open Source architecture.
I started with this basic layout and dropped code into regions until I had the second graph.
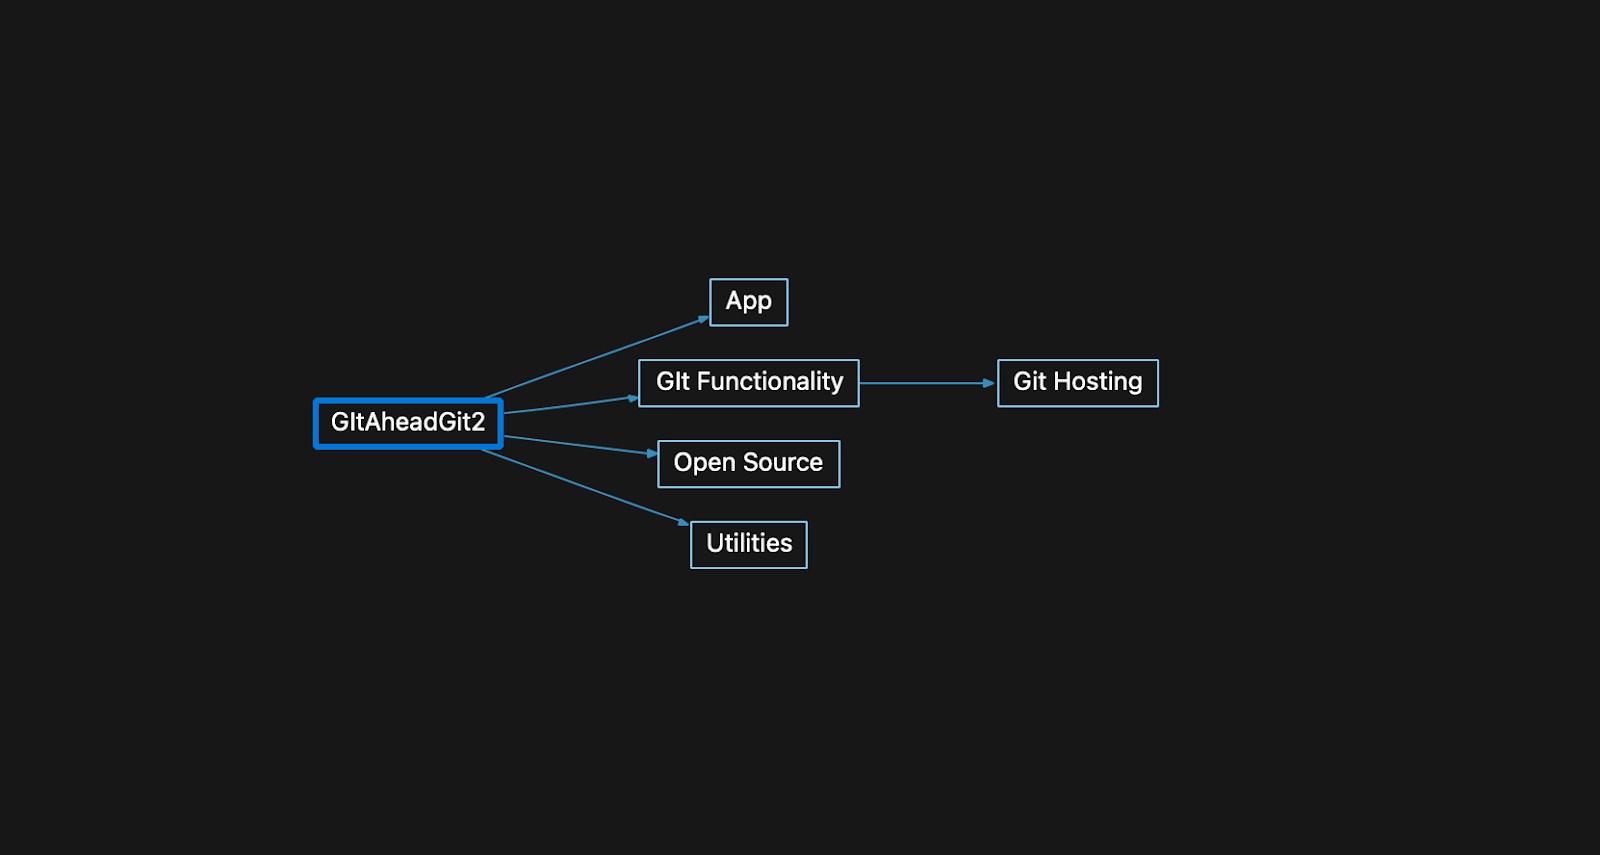
What I started with. I’m going to drop code here in the architecture builder.
Step 2: Explore Dependencies on the Open Source Architecture
I’m interested in Open Source, so I right-clicked on it, and chose to graph its dependencies:
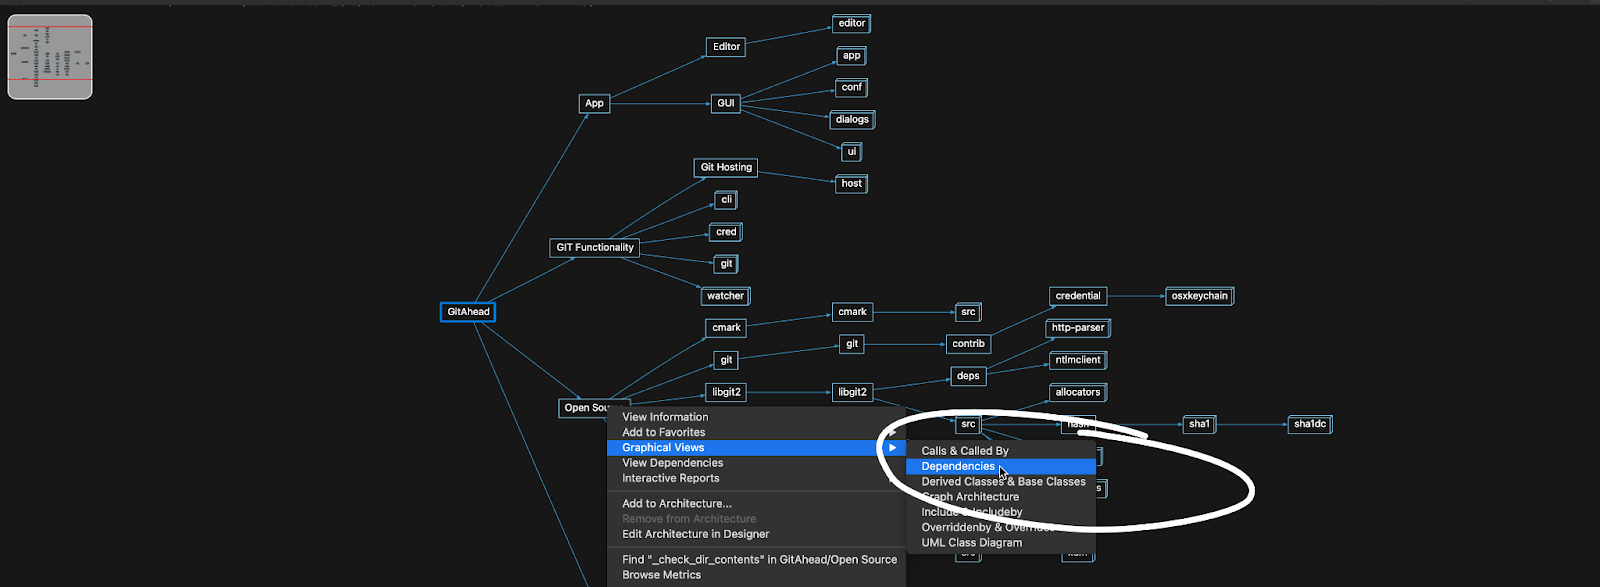
Which gave me this amazing graph that shows what depends on Open Source and how many dependencies there are (both directions).
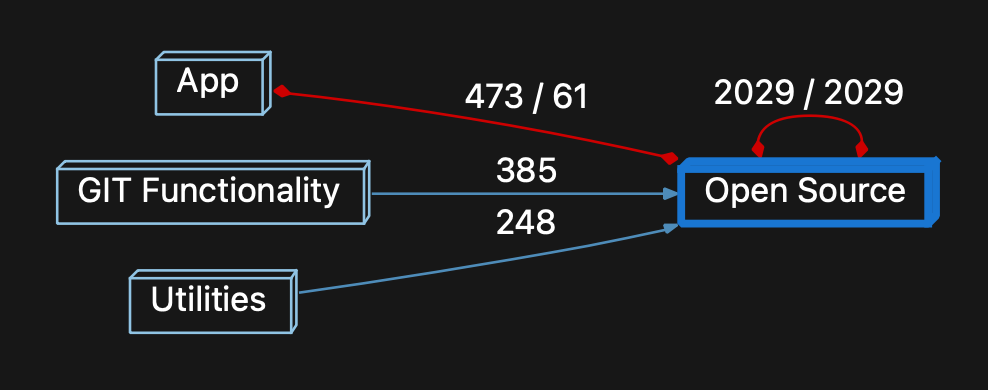
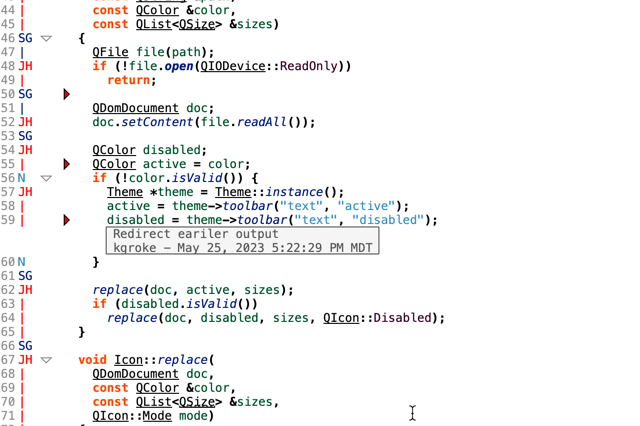
Whoa…. Circular dependencies (red edges) between the Open Source AND my code??? Interesting, let’s explore that. Double click on Open Source, and then App, and we see:
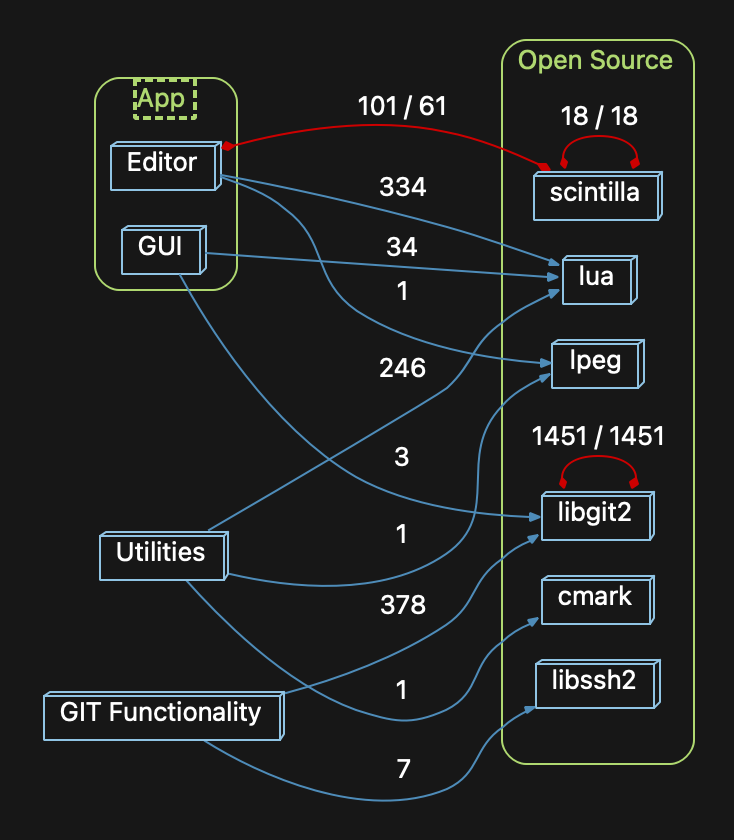
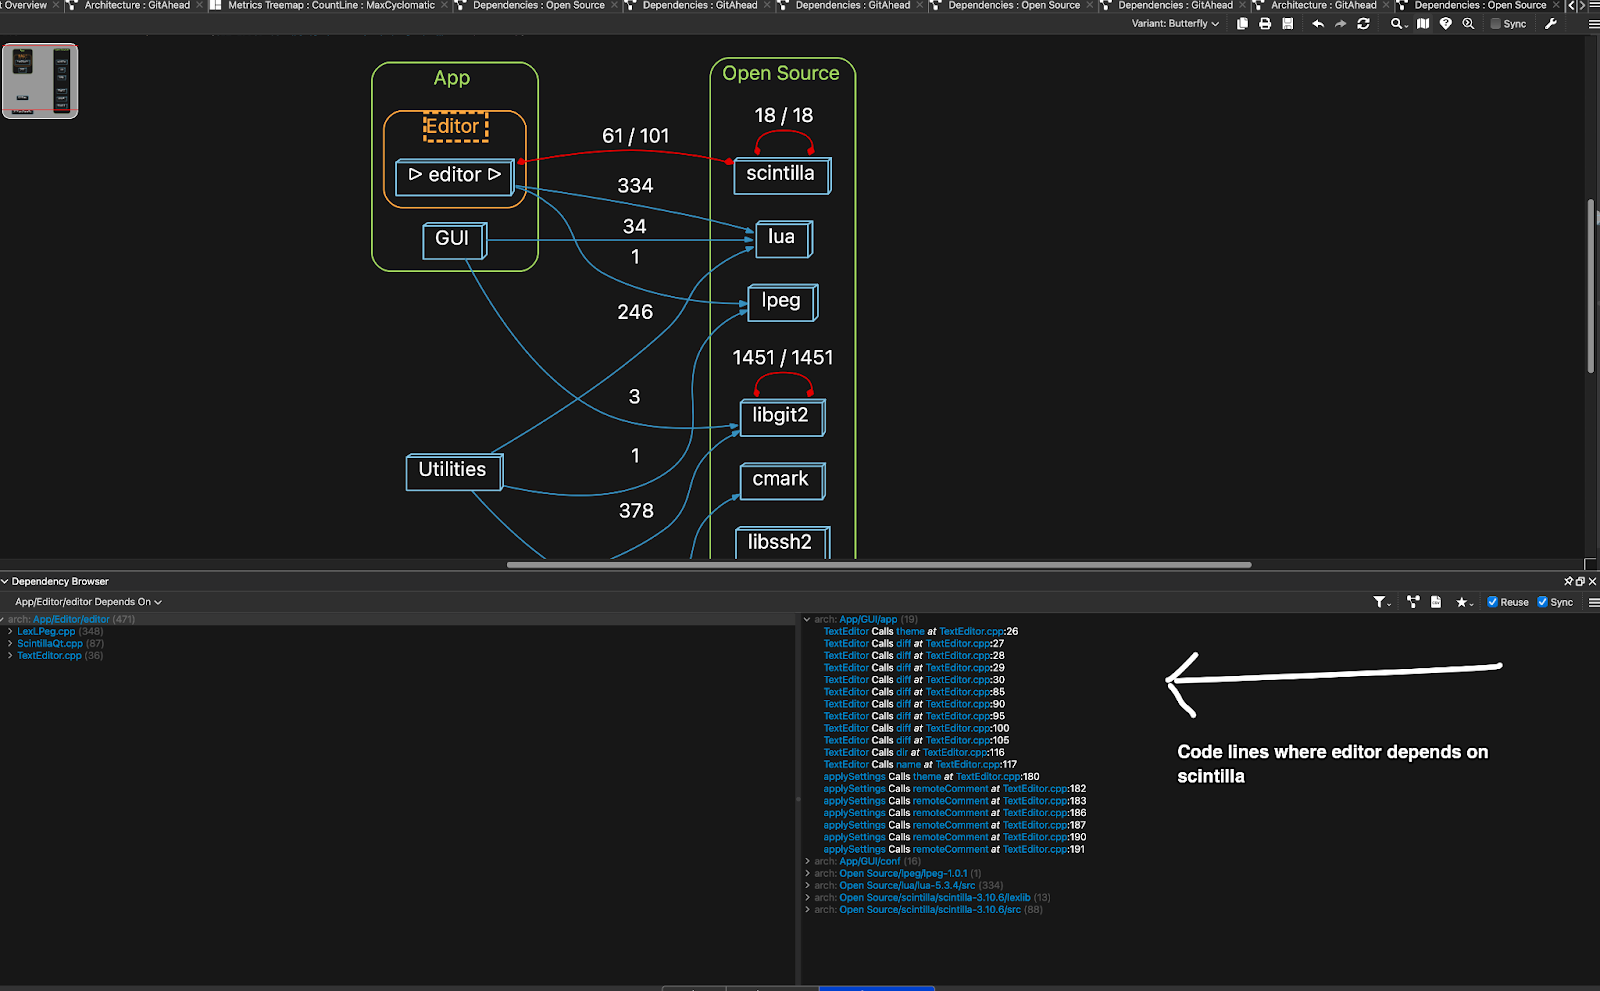
Our implementation of the code editor in GitAhead is circular with “scintilla,” which is an open-source editor framework. That makes sense. But I’ll check to see where/how.
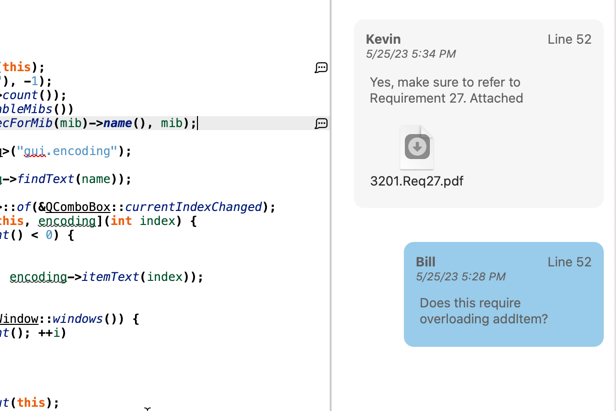
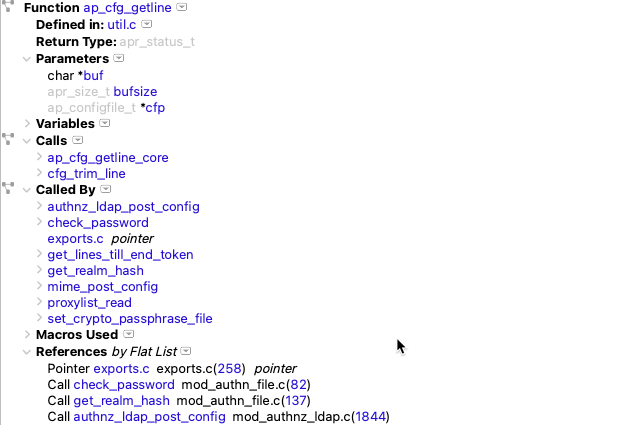
Just click on the edge, and I can see and visit exactly where using the Dependency Browser:
Step 3: Measure the Dependence on Open Source Code Using Metrics
Cool. So now I’ve got an idea of how many spots in my code I’m depending on various open-source projects. I also know where each dependency is if I need to rip that project out for technical or business reasons.
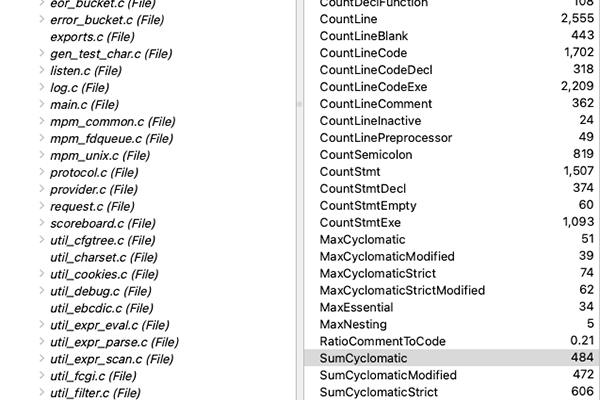
How much Open Source am I depending on? That’s easy–choose “Metrics Browser” from the top menu, choose “Open Source,” and basic metrics are shown:
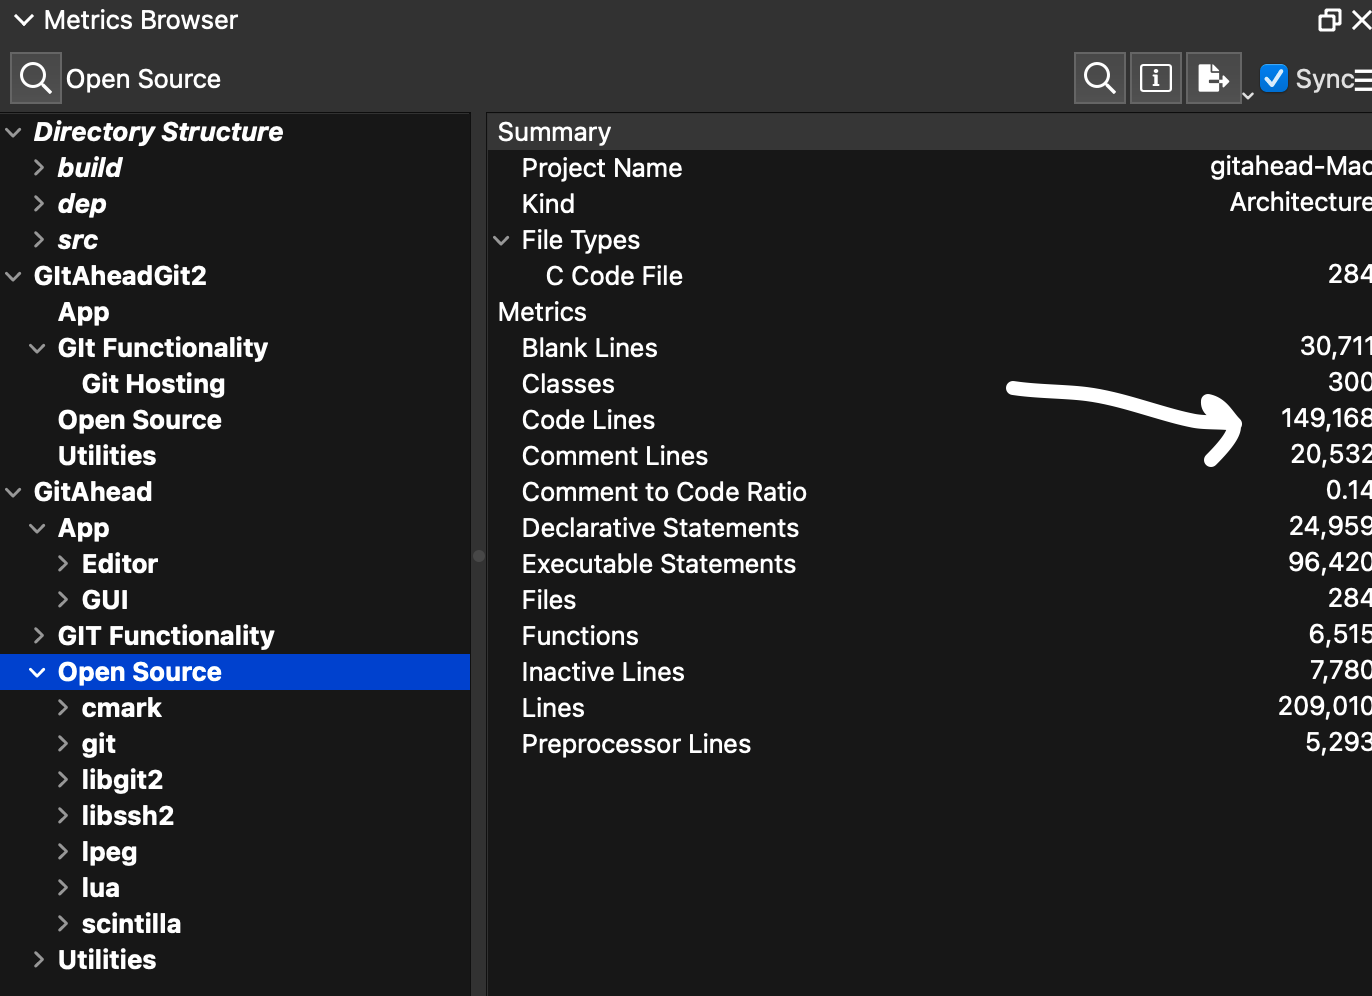
I can also export a LOT more metrics by choosing “Export Metrics”–and go to town with Python/Pandas and get my “data science” thing going.
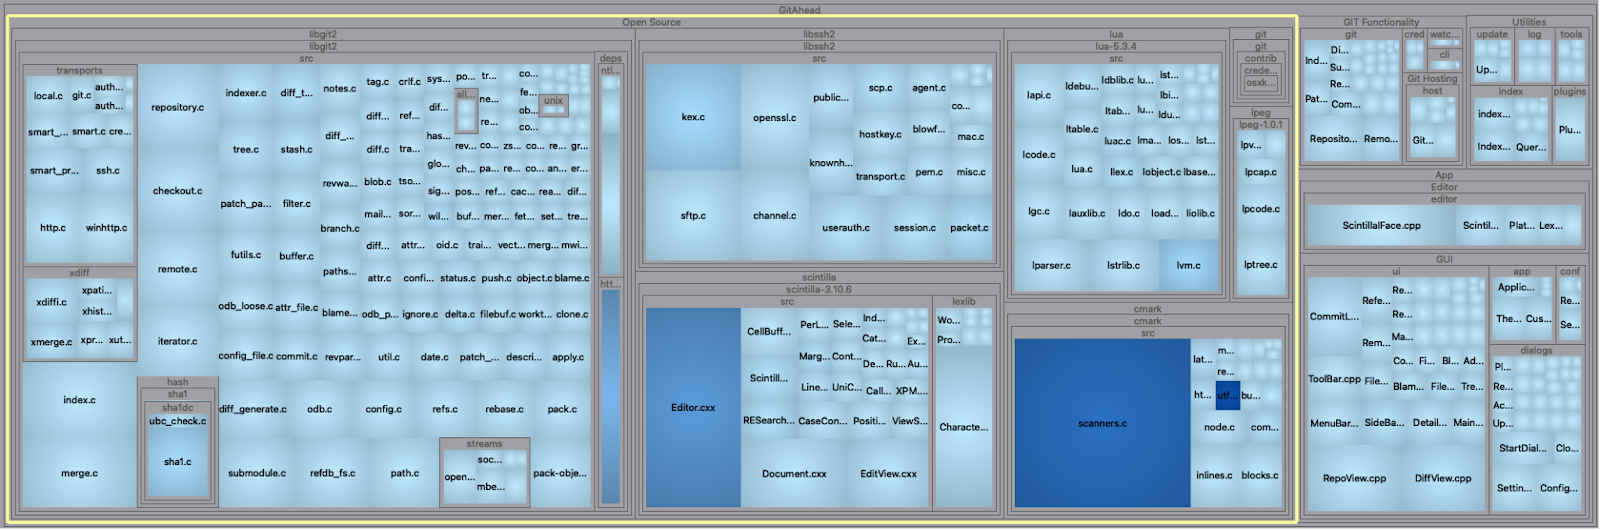
For fun, I can also check out the “Treemap Metrics” view showing (in the yellow box) the relative size of the other open source projects used in GitAhead.
Summary
This took me:
5 minutes to architecture the code, find the Open Source, and place code in a rough approximation of functional purpose and open source or not.
5 minutes to look/think about it.
10 minutes to write the first version of this article.
Try it on your code!
The next step would be to update the architecture building to a script driven “auto-architecture” that would find open source licenses and place the code there in the Open Source architecture.
Hope this helps. If you have questions or need help doing this for your code, email [email protected]
Thanks,
Ken Nelson
[email protected]