TLDR:
Ken shows how a few minutes making a functional decomposition architecture using Understand’s Architecture tool can make big graphs into simpler useful graphs, and also help you organize key information about your project.
Details:
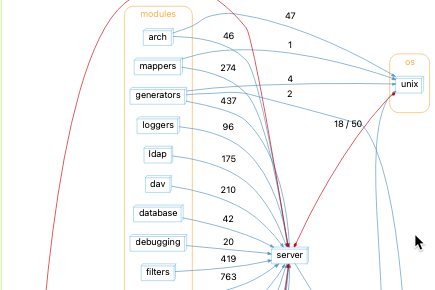
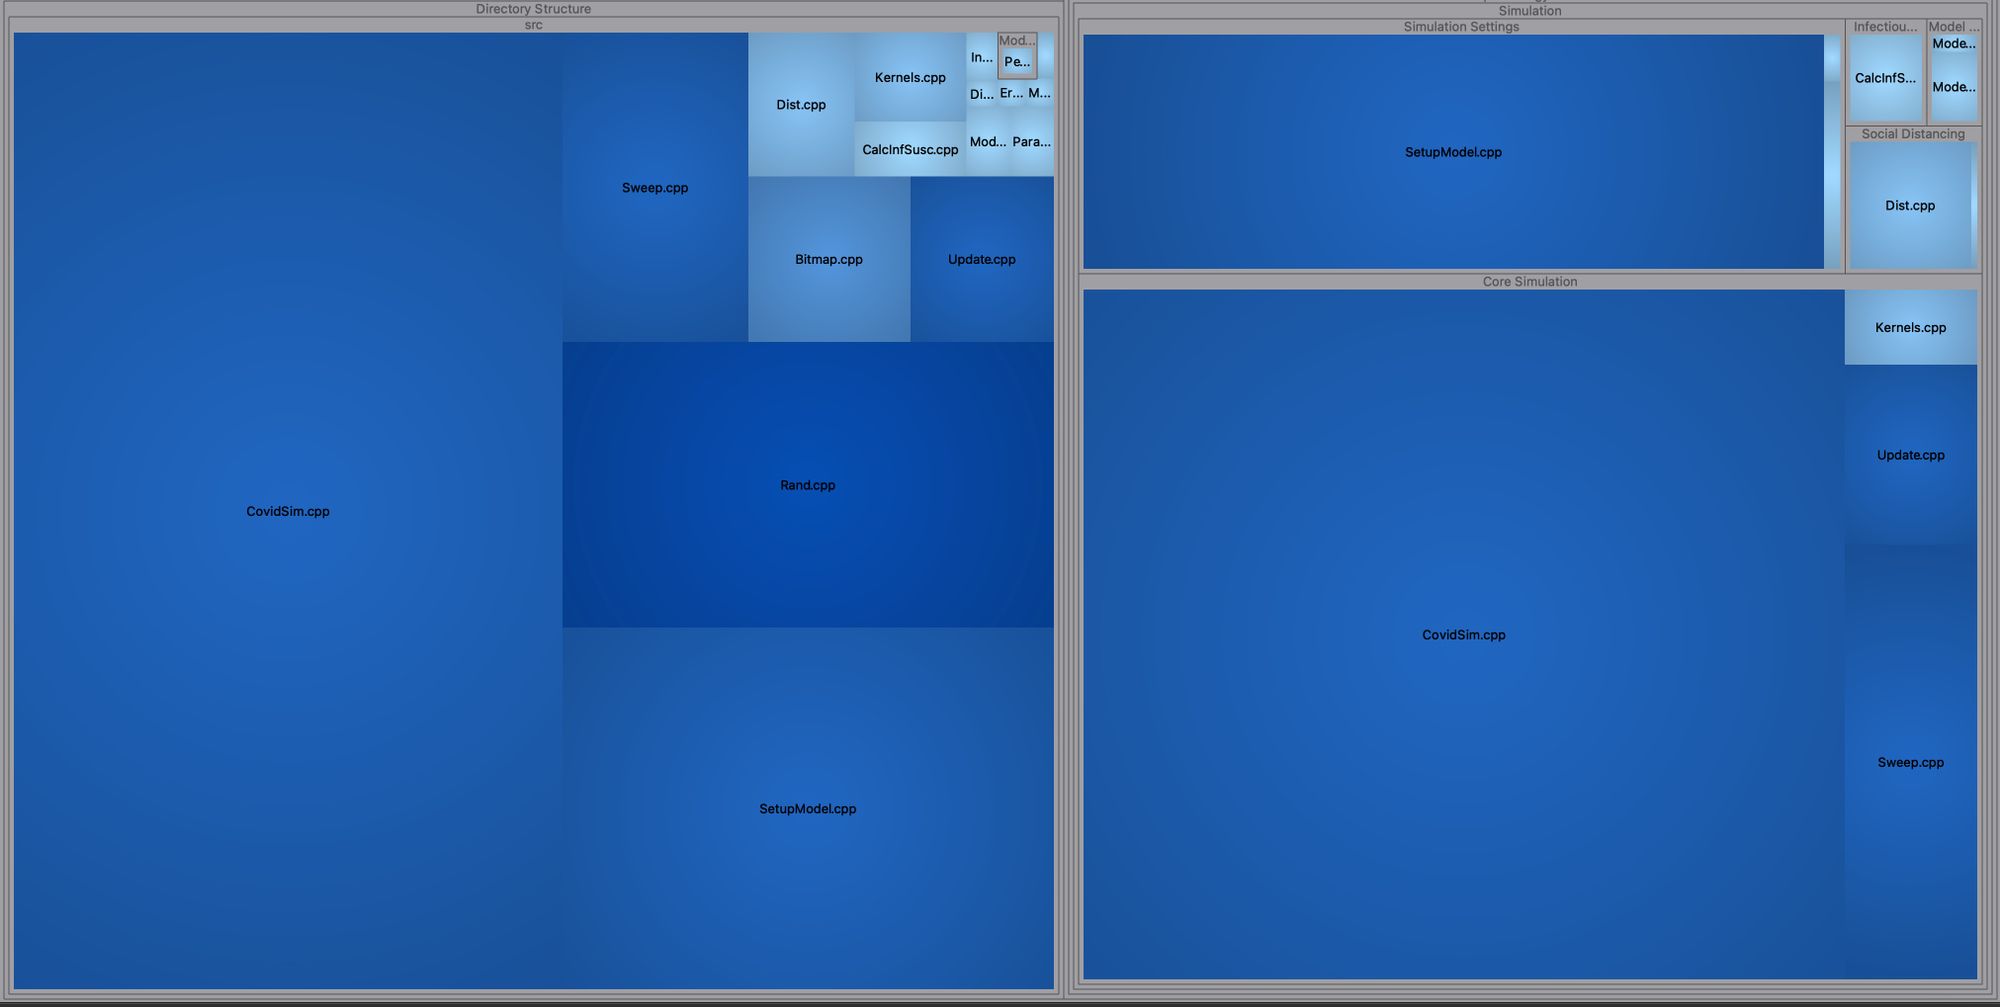
I recently finished an examination of the source code for the Imperial College COVID infection modeler. This was a simple project, just 47 C/C++ files. But look at the dependency graph generated by default using just the source code files.

I then took a 1/2 hour and built a functional decomposition architecture using Understand’s Architecture tool. It’s a simple tool but it yields powerful results.
I now have this graph, or way of thinking about and organizing information about this code:
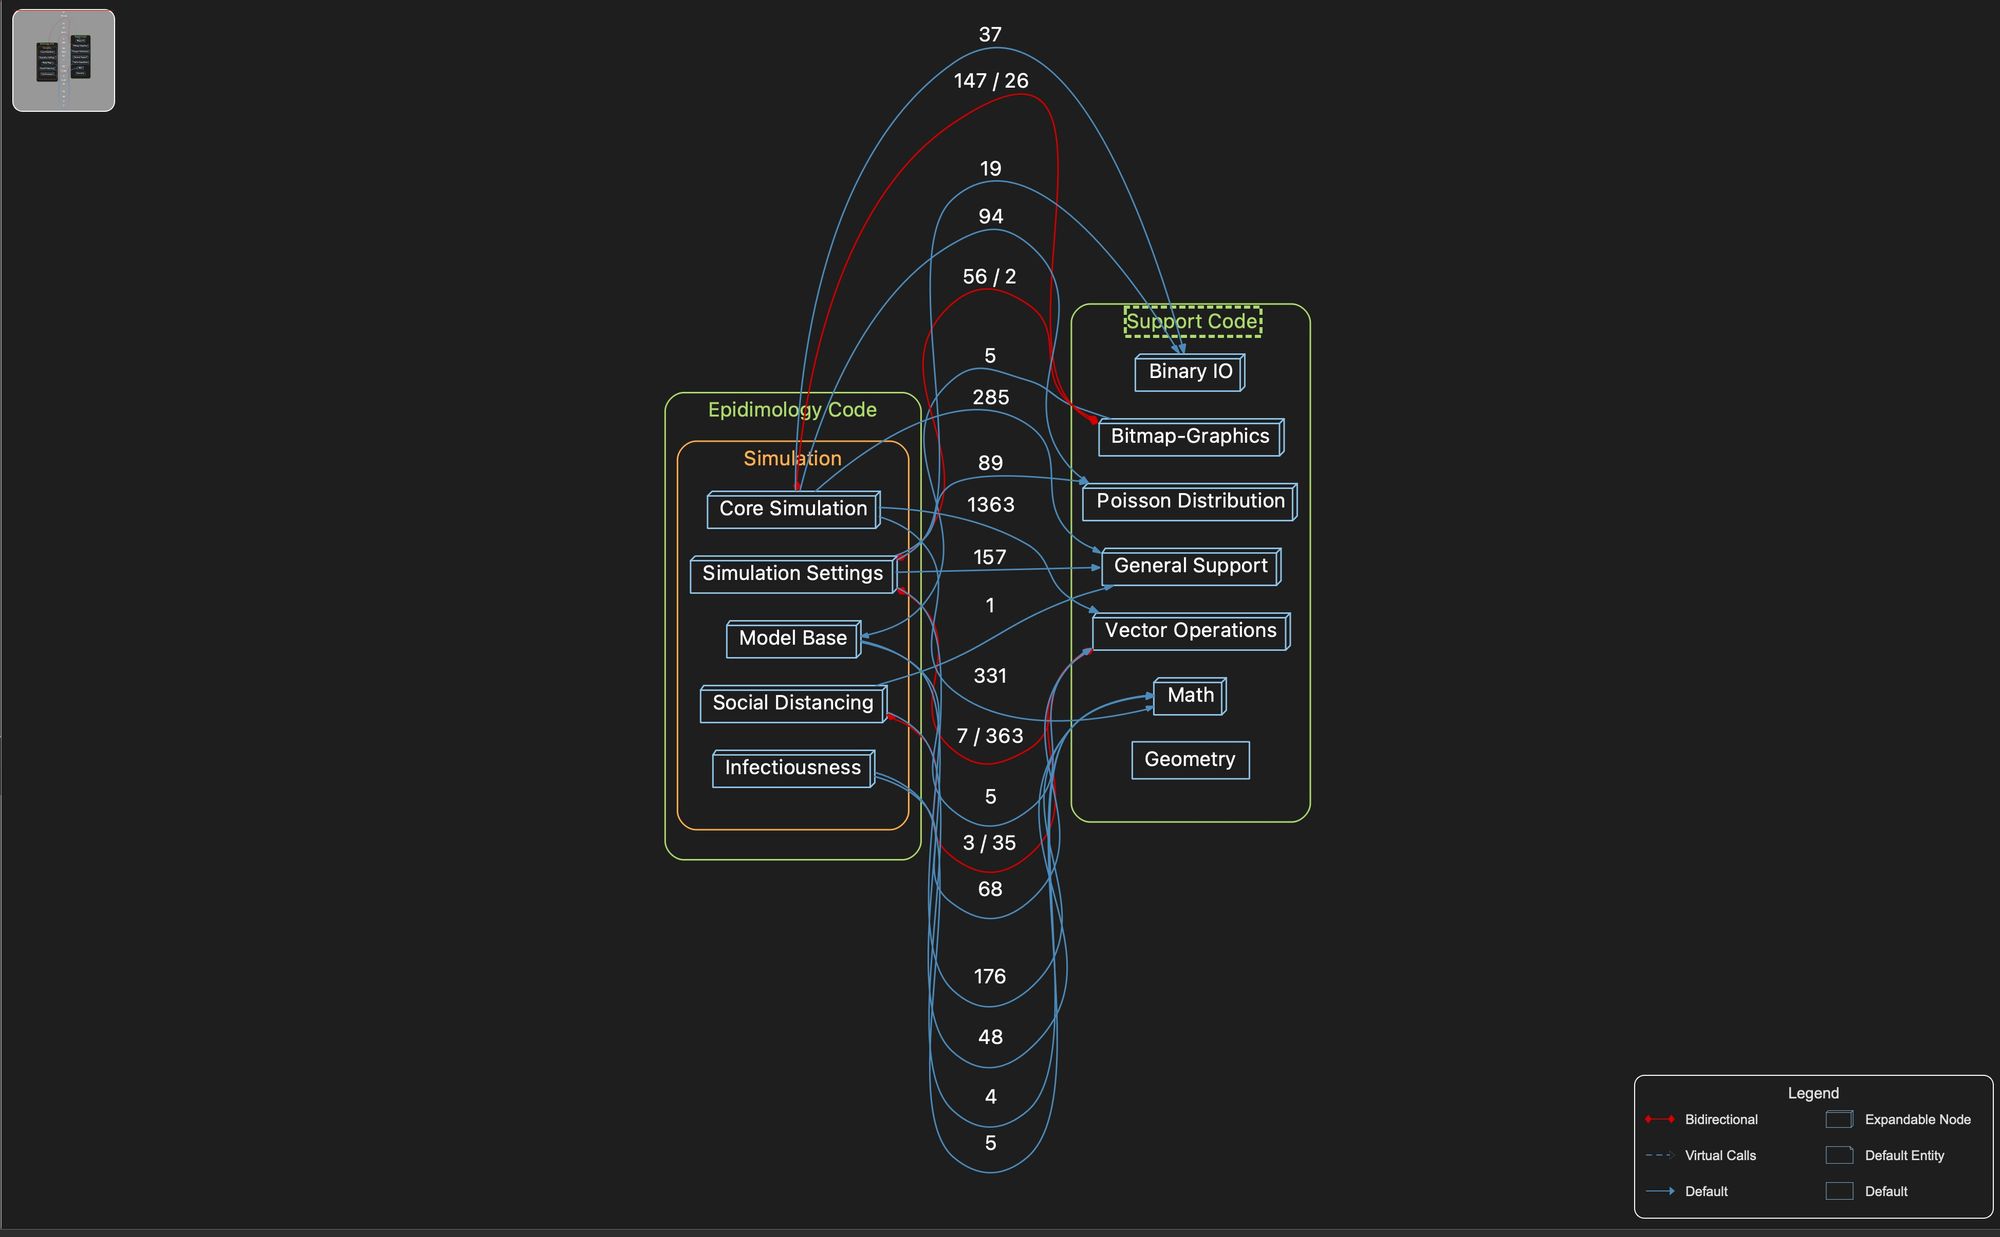
Quite a difference!
I’ll write another article with more specifics on how I made this architecture. I’d do it now, but I know (since I run the company) that we are re-writing the Architecture builder and I’m sort of the good kind of lazy – so I’ll write that when the new UI is done.
But basically what I did is this….
I walked thru the code, scanning, reading it and thinking about “What would a human call this?”. When I started to get common things – like Simulation Settings, or “Support Functions”, I started adding Architecture nodes.
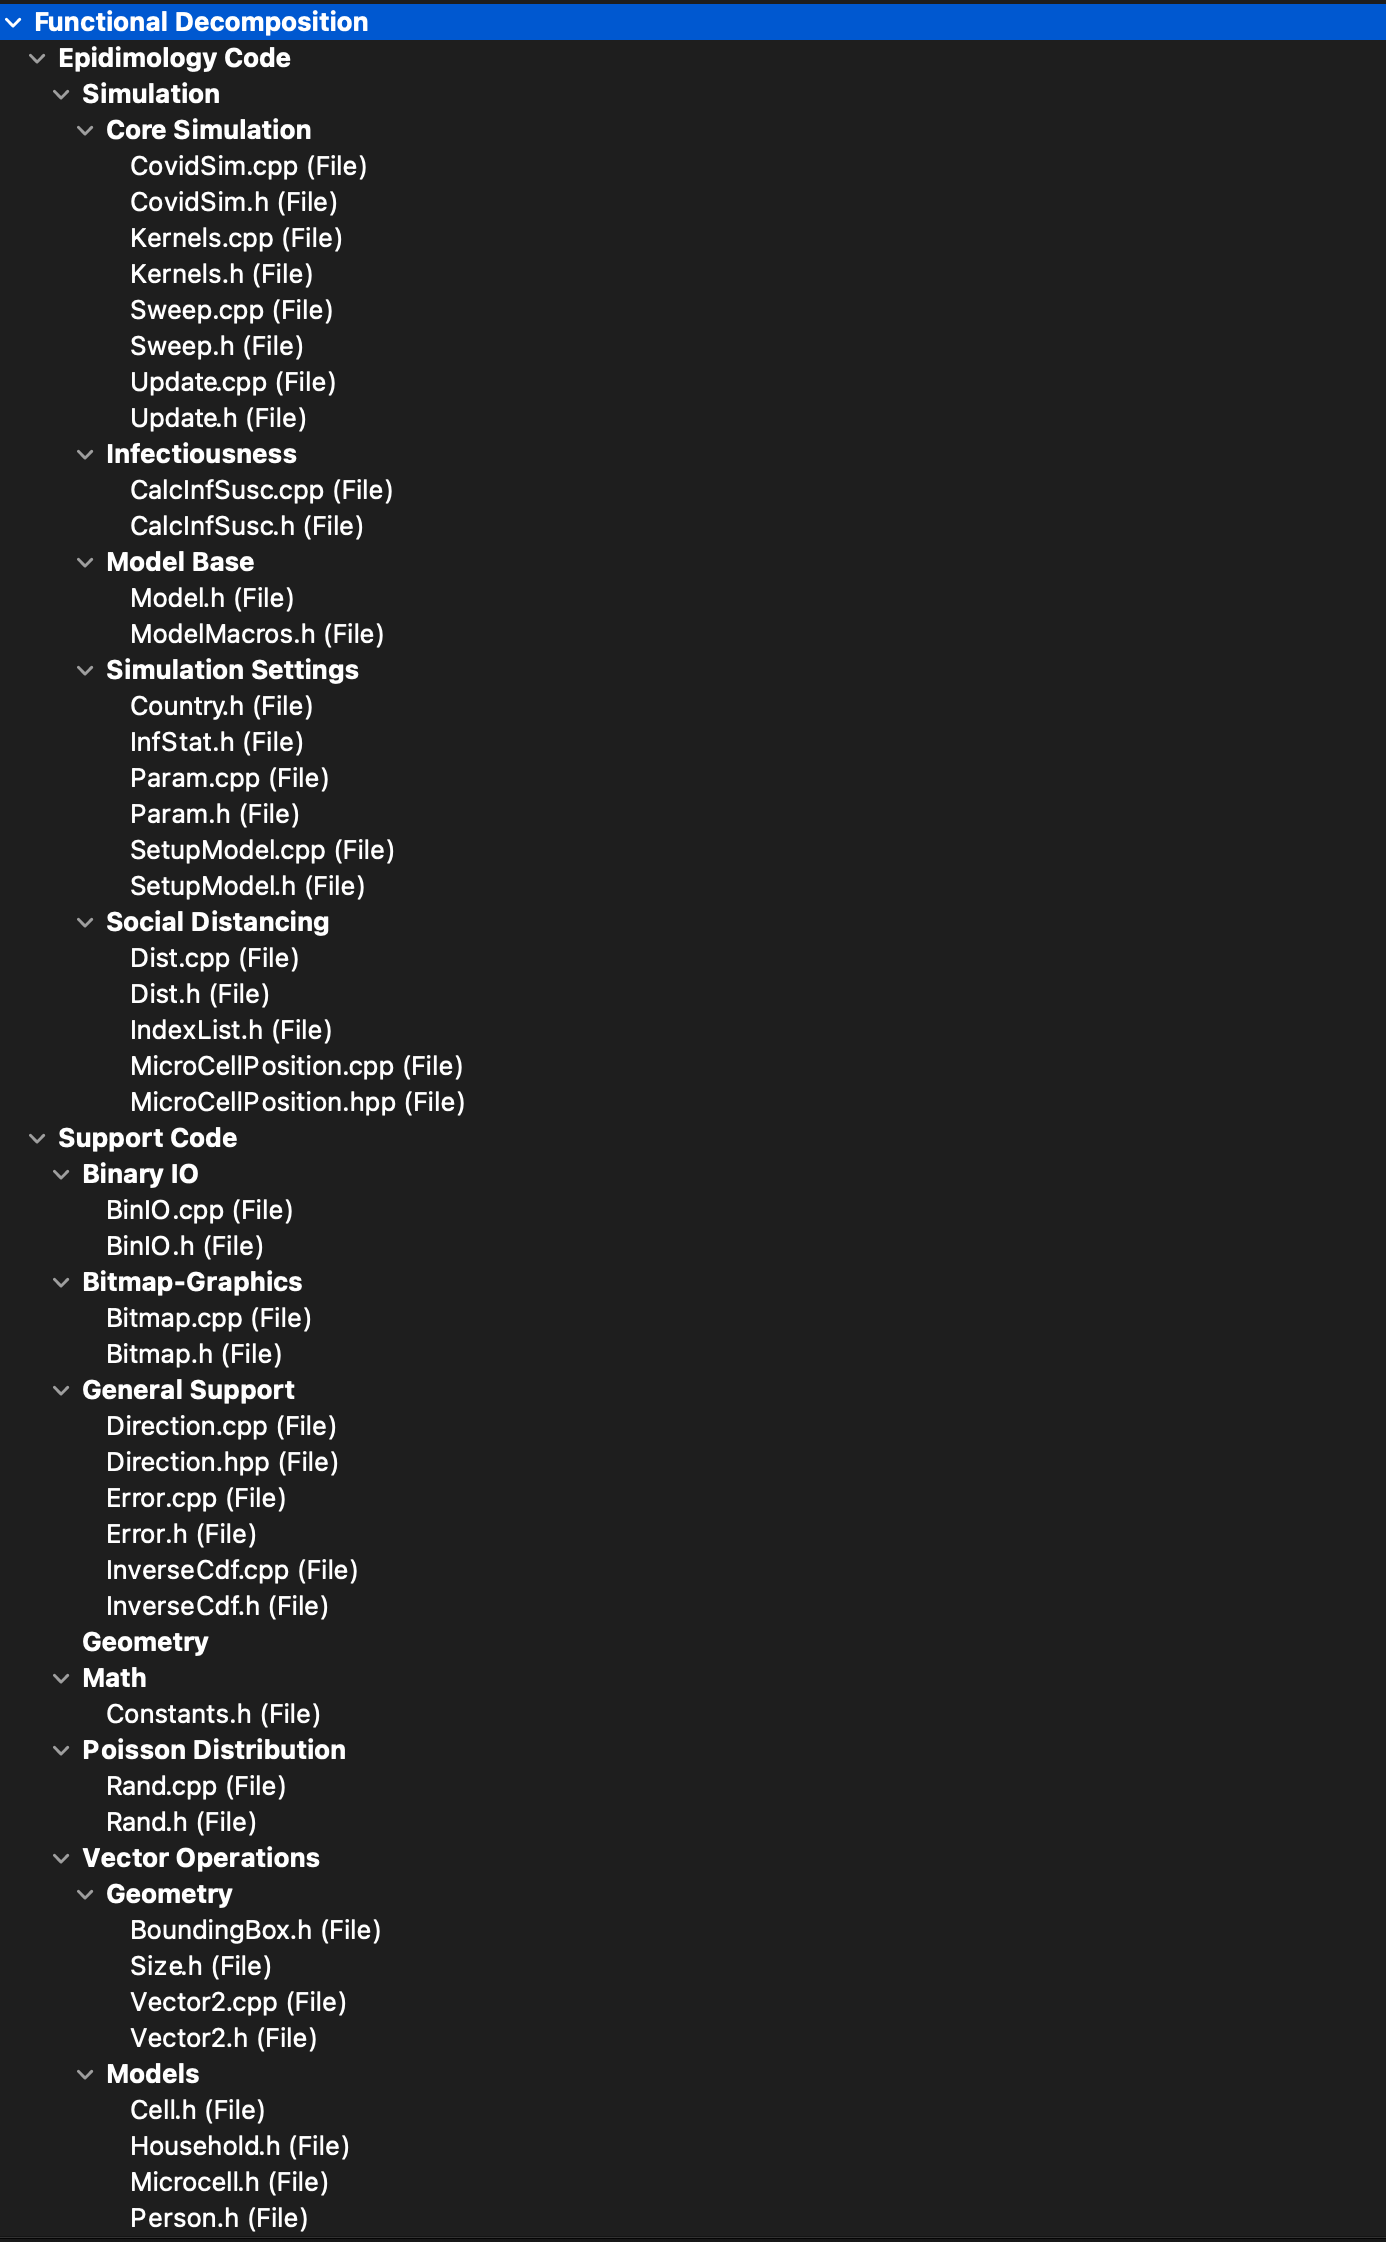
I did this for a while, maybe 10 minutes on 15K lines of code. And then I re-organized and renamed them so that they ended up looking like this:
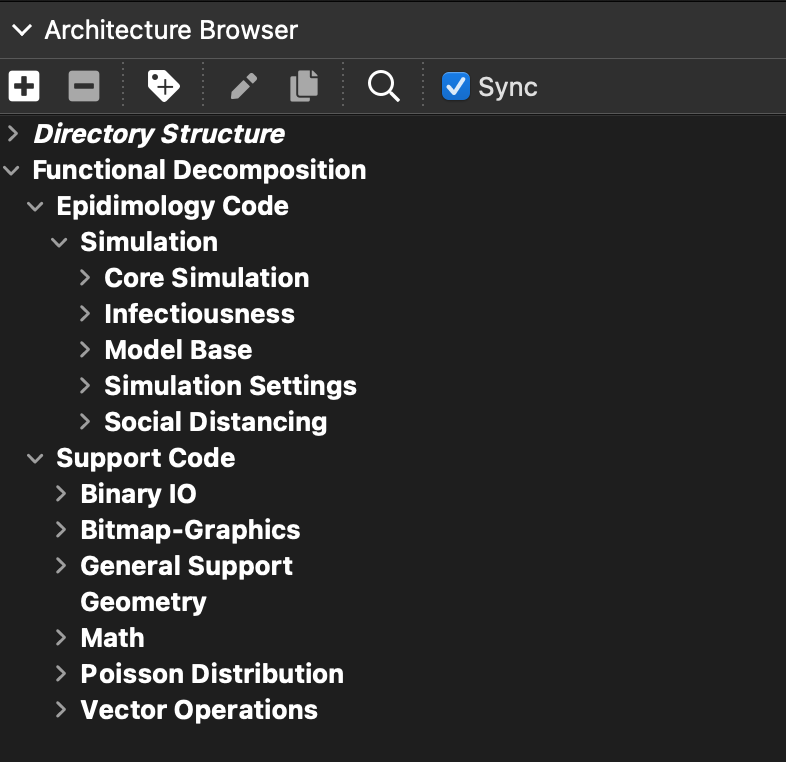
Then I put the source and header files in their appropriate human named architectures, and the result looked like this:
This architecture, which can be named anything, but by convention I called it “Functional Decomposition” is available in many parts of Understand.
I’ll show some here, this isn’t an exclusive list, and note the utility extends into our PERL and Python APIs that give you the full power and knowledge of Understand in your own programs.
Dependency Diagrams
I showed this above and do it again for completeness. This is a MUCH simpler graph that tells you something in a clear and useable way.

By the way; You don’t have to just use functional decomposition. For instance, you could architect your code as “Stuff that Can Launch the Nuke” and “Stuff that Can’t Launch The Nuke” and “Launch the Nuke” and see who violates that architecture layering.
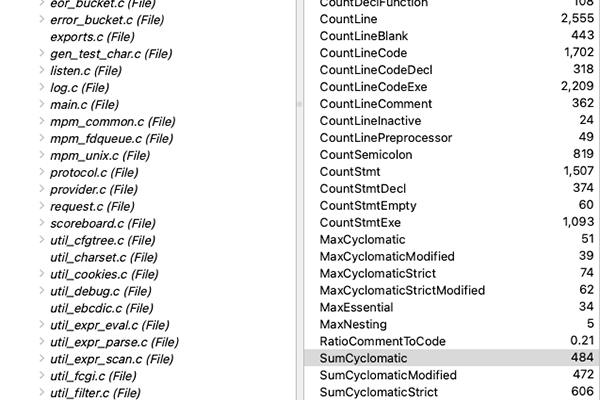
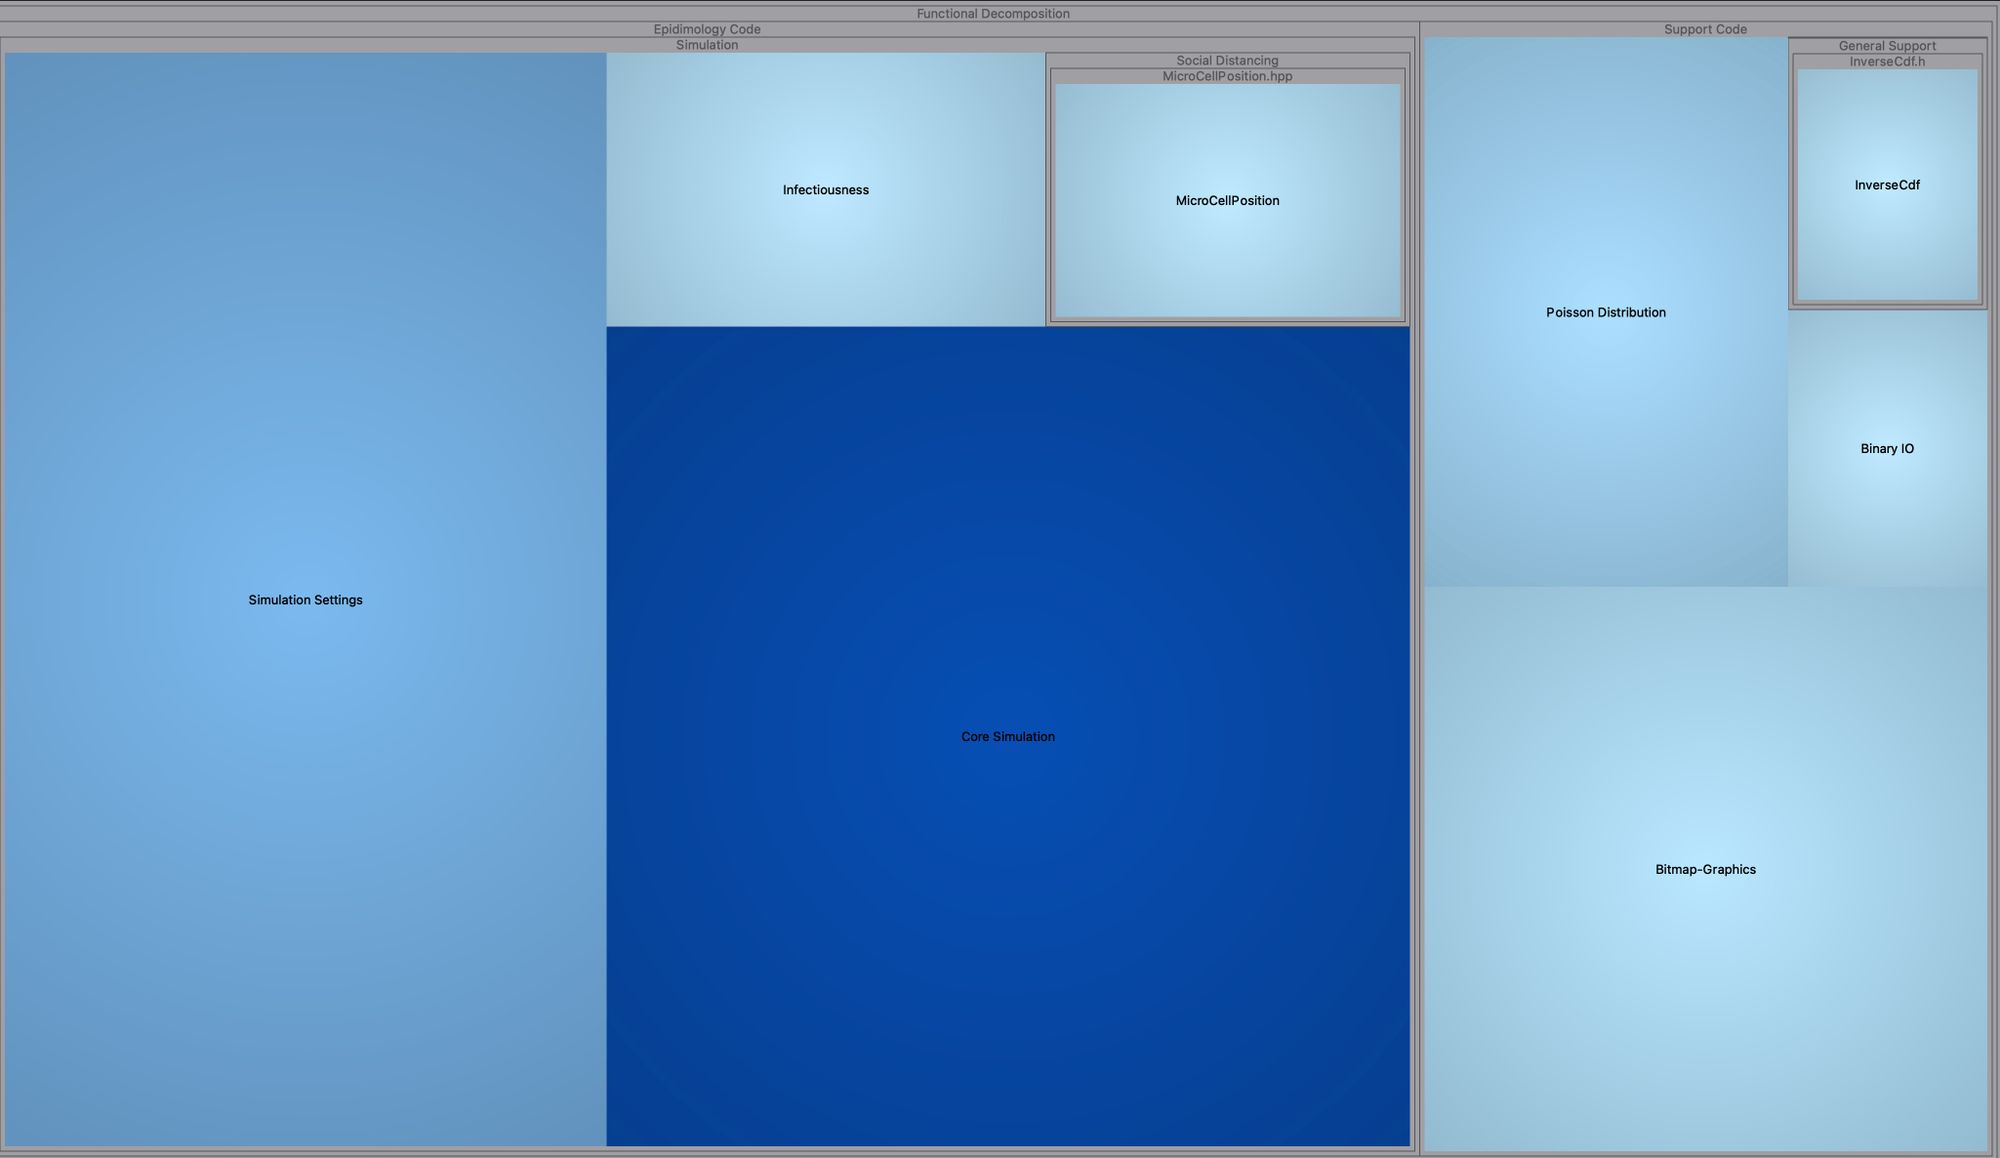
HeatMaps of Code Metrics
Here I’ve built a metrics treemap, ordered by Functional Decomposition using Average Complexity as the size of the box, and LinesOfCode as the color.
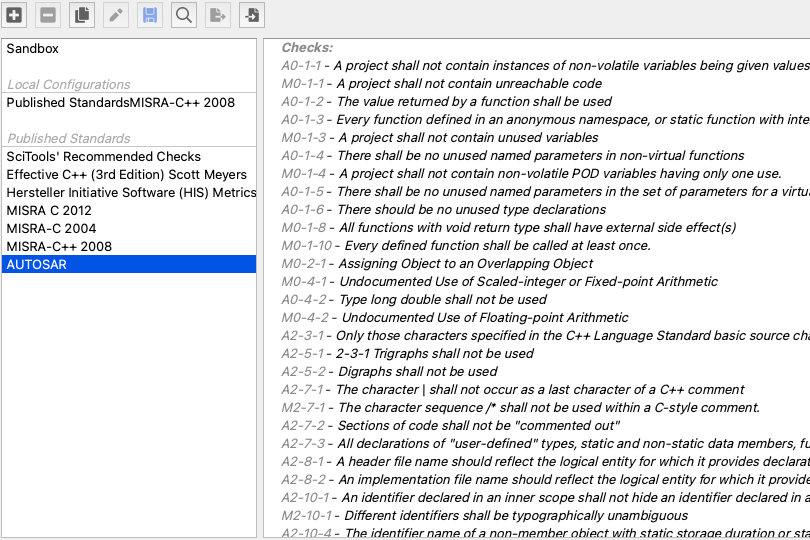
CodeCheck Violations
Here I’m looking at CodeCheck Violations where the box size is the number of violations in the architectural area, and the color of the box is the breadth (or what % of violations I was checking for) of violations.
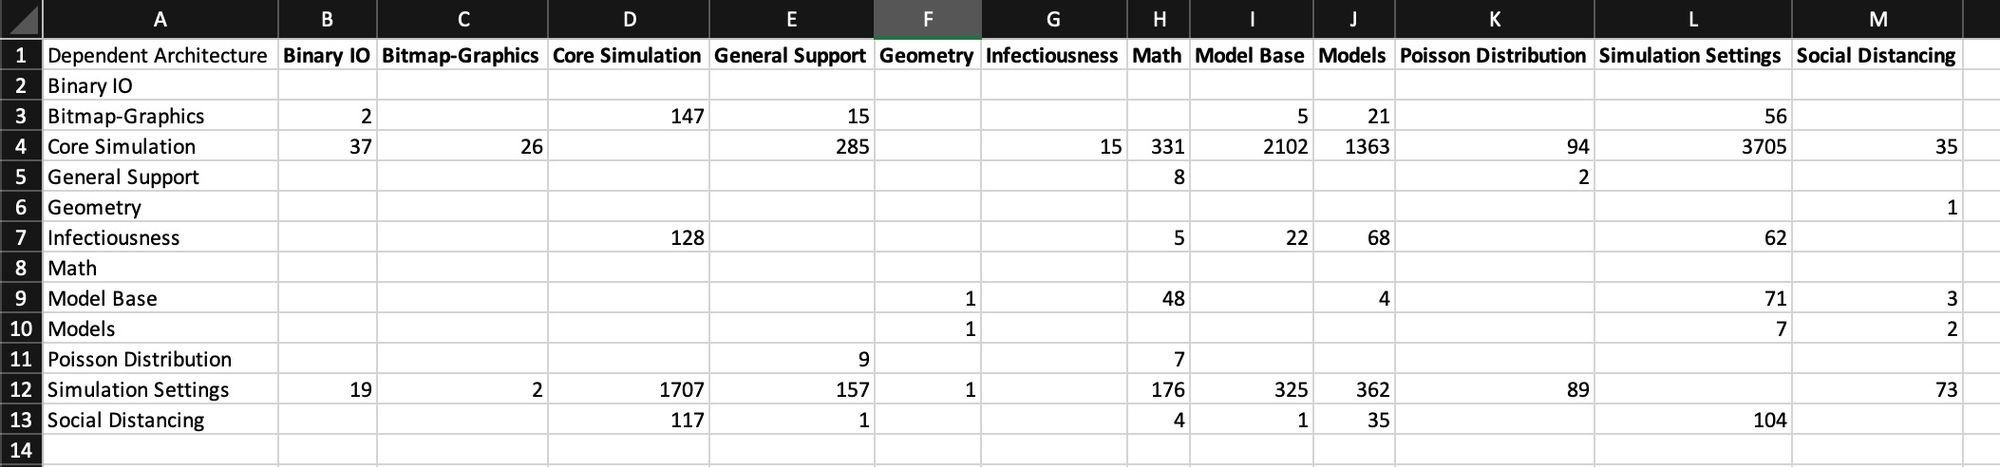
Exporting/Organizing Data
Here I export the # of dependencies between architecture components to a matrix CSV useful in Excel or Python Pandas (or R or Matlab). Super useful!
Summary
This is what we started with:
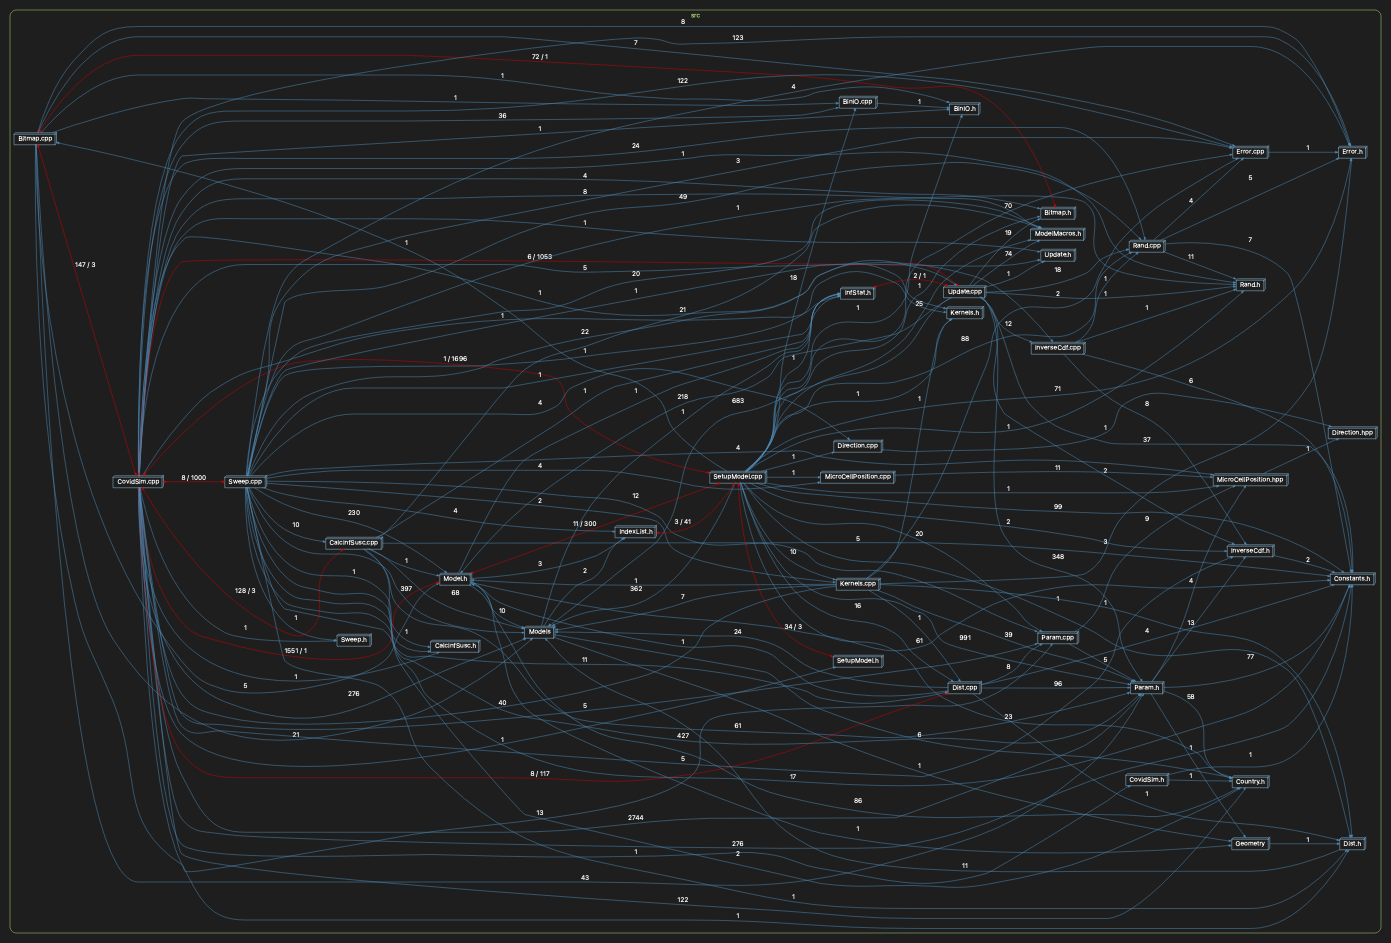
but with a little thinking, we re-organized our code without changing it and now have an organized way to present, think about, and analyze our source code.
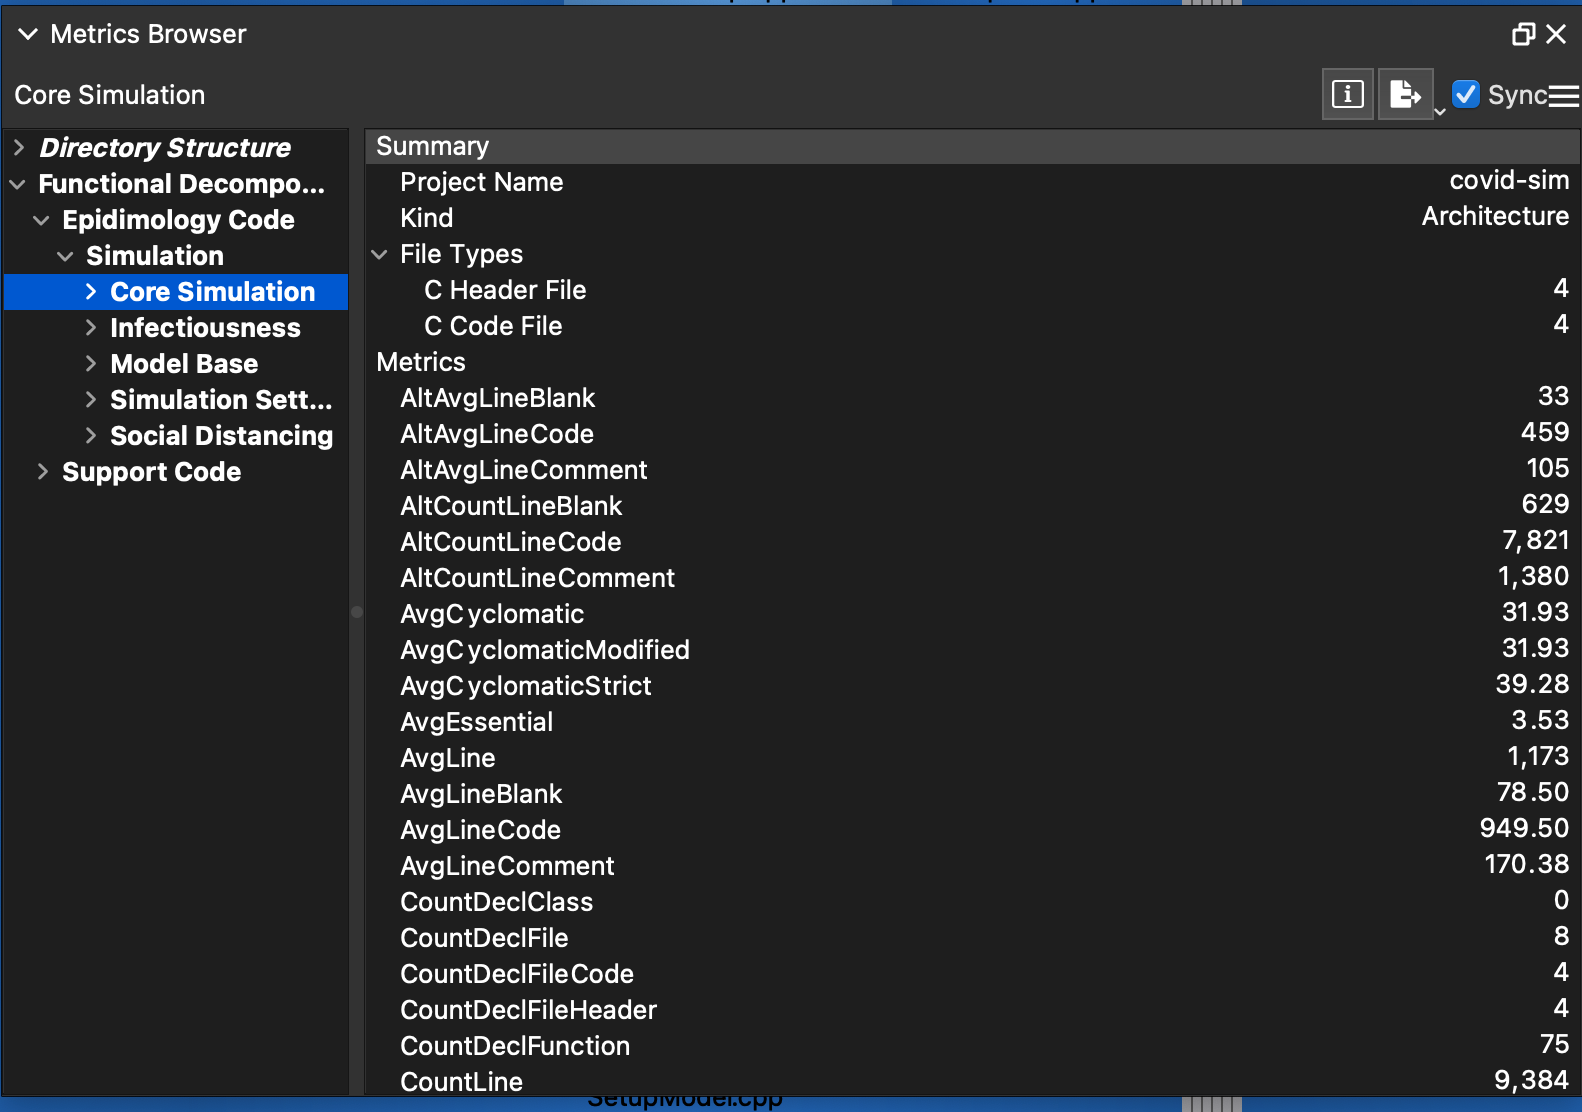
P.S. Here’s another I missed above… organizing and seeing ALL metrics by architecture. Slick!
Cover Photo by Ryan Ancill on Unsplash