

Graphs represent the ultimate abstraction of code – being able to visualize your entire project or zoom in on a specific piece of it in just a glance. You might also find them a useful tool for making your case to management. Understand has many different graphs, and each of these graphs has several different variants. This is not an exhaustive list but demonstrates the most popular graphs in Understand.
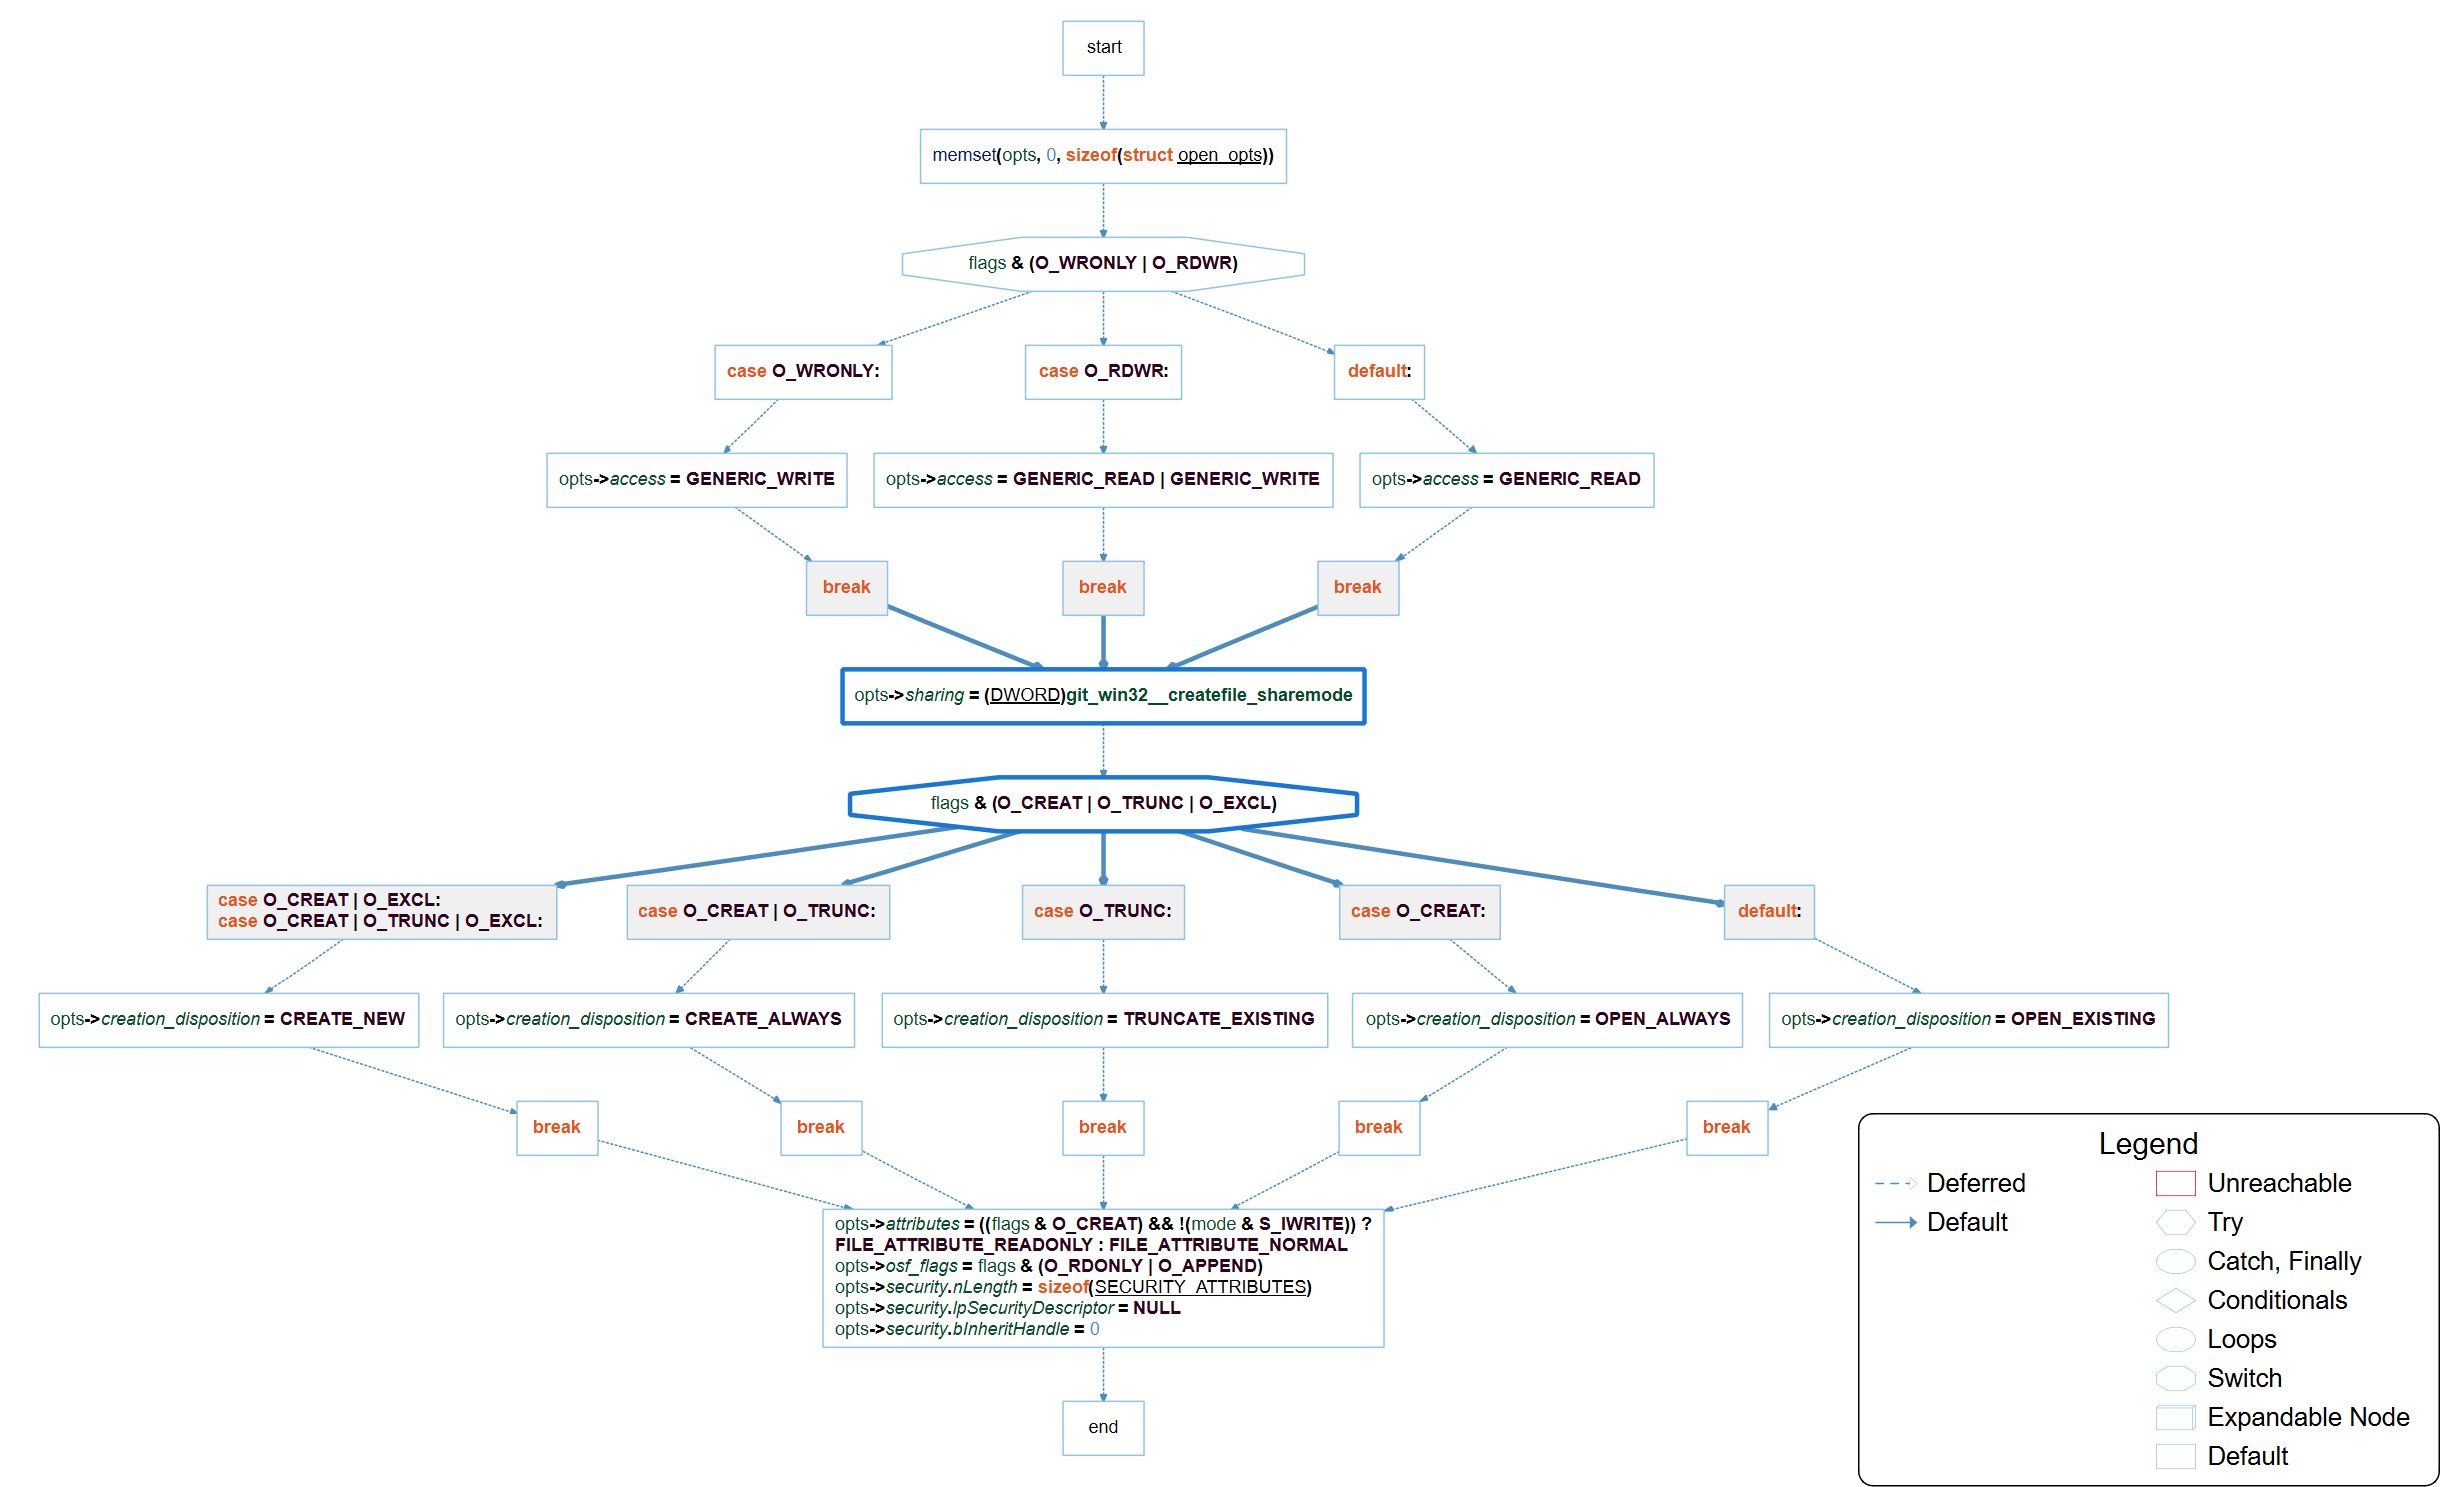
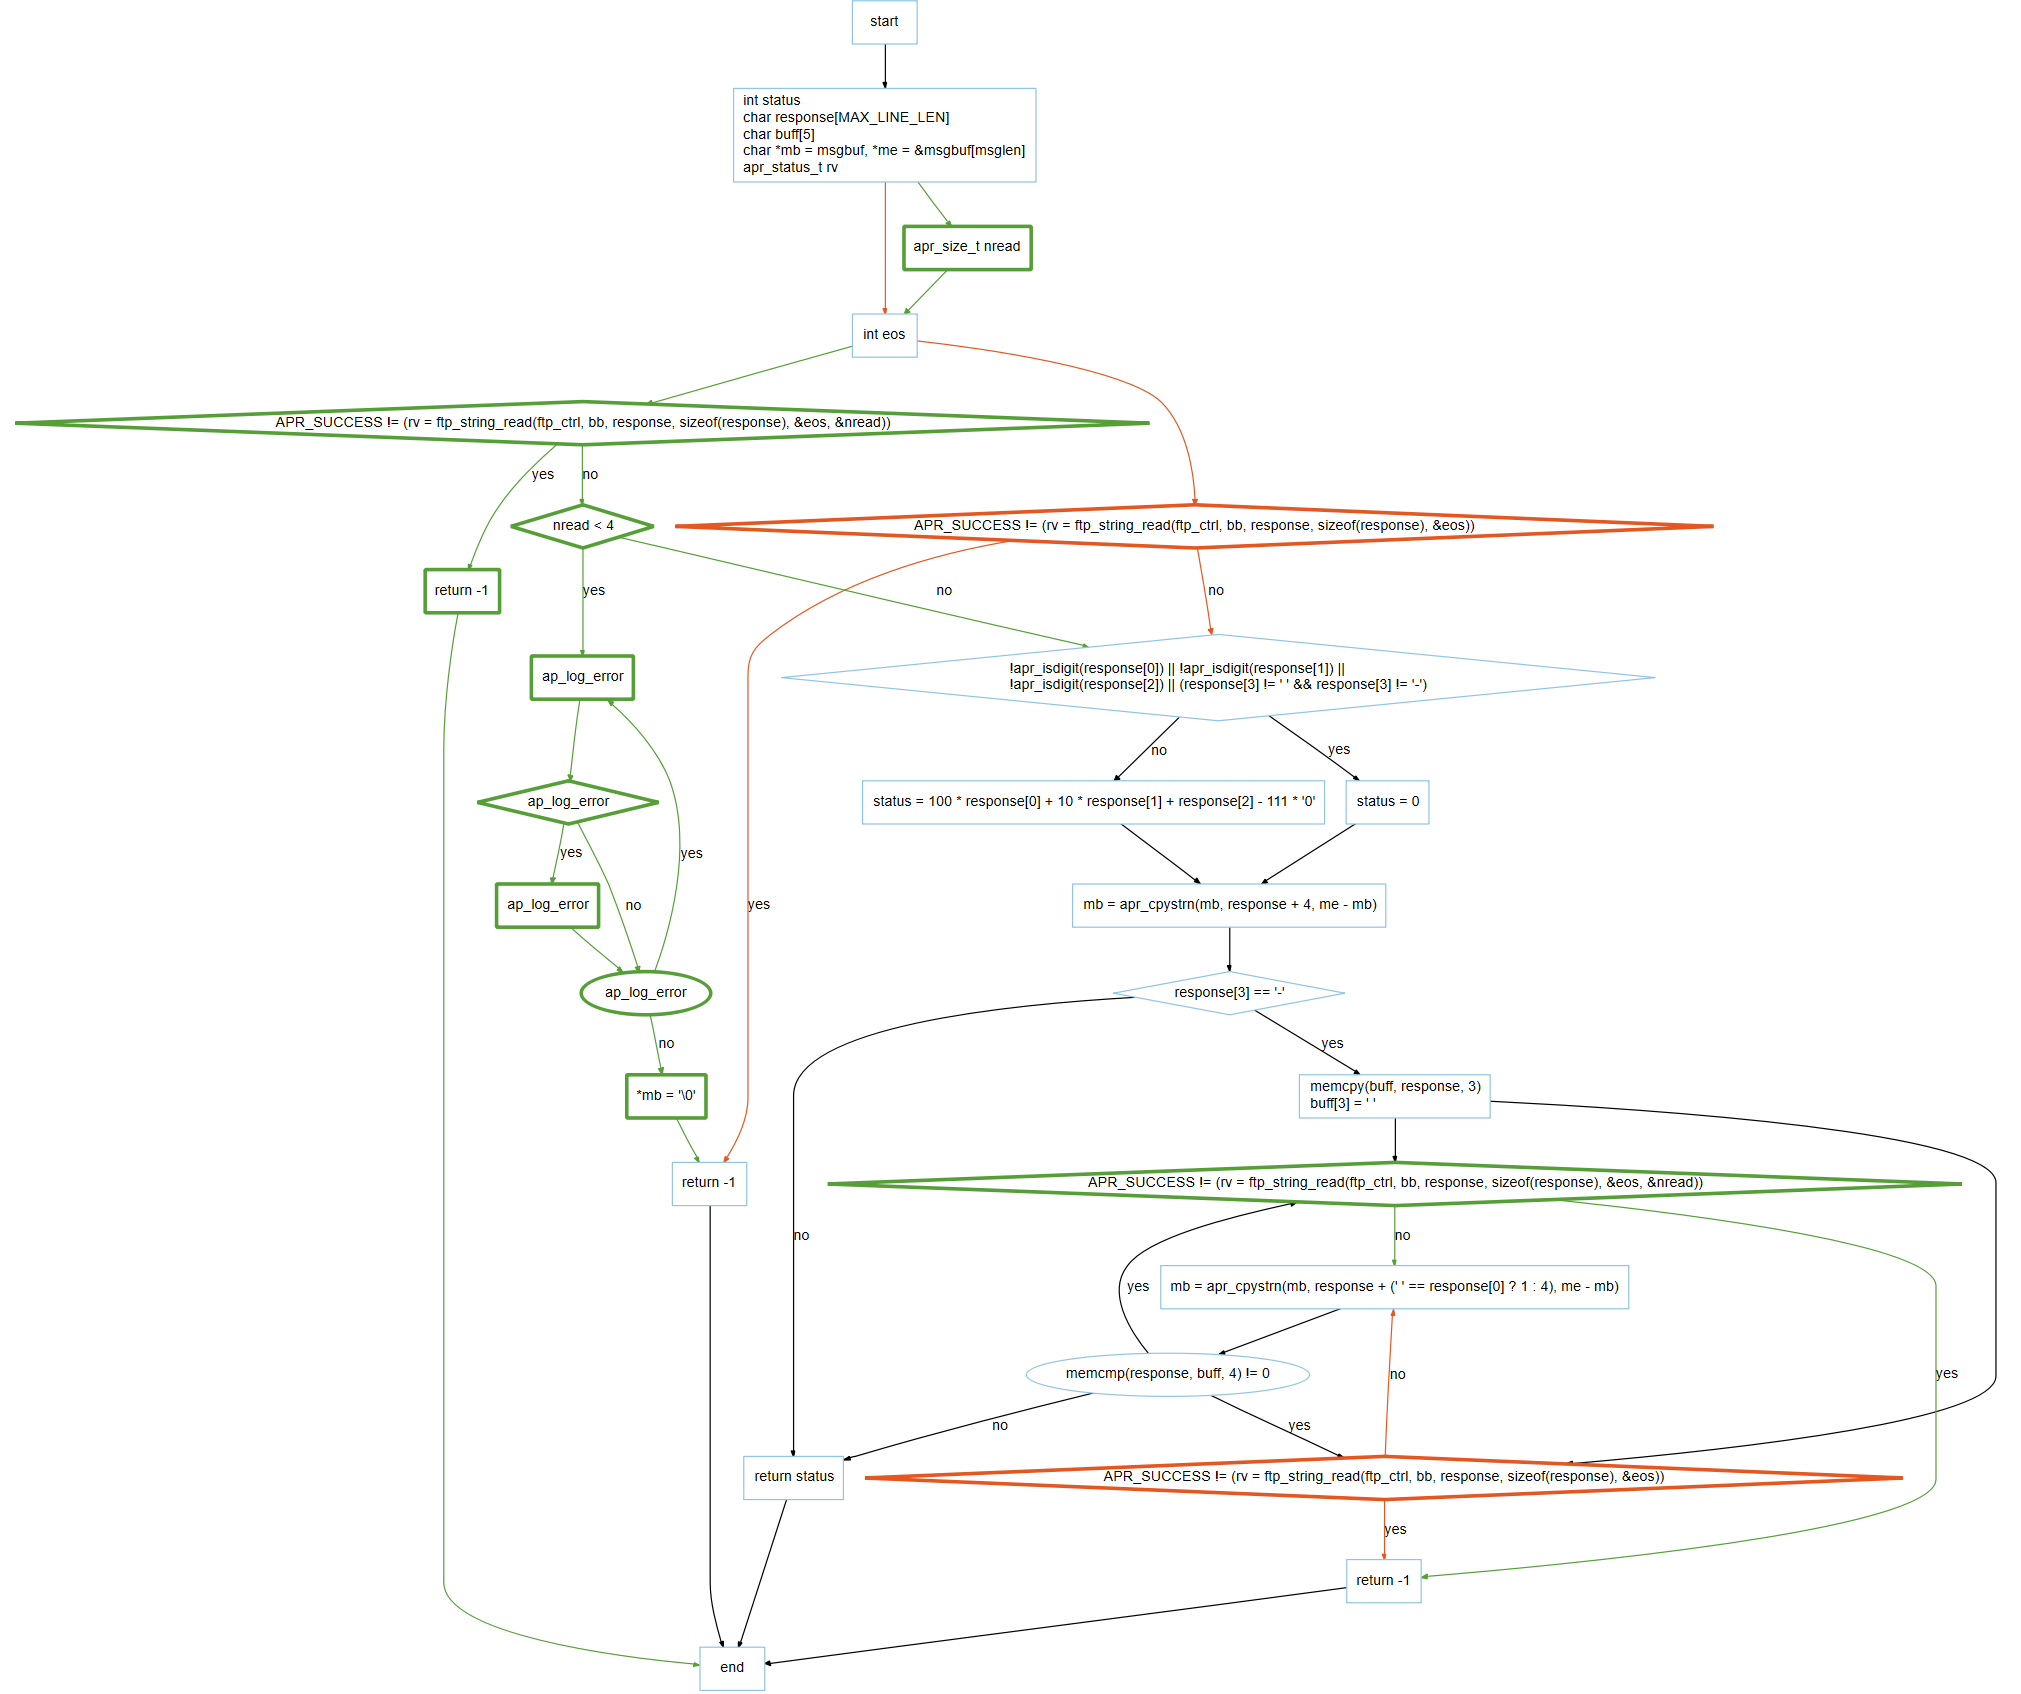
Control Flow Graphs
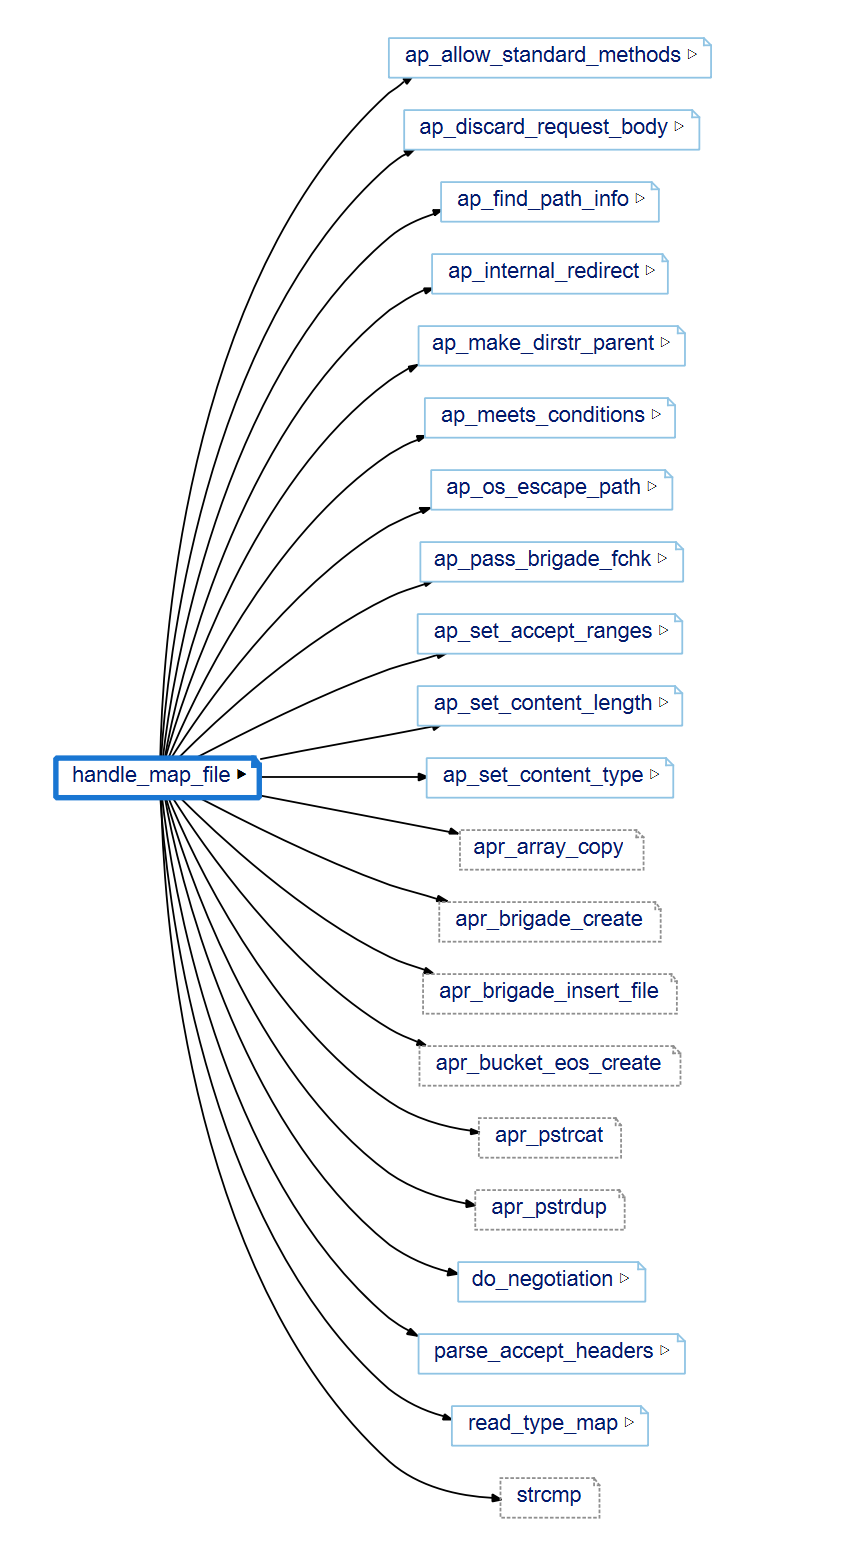
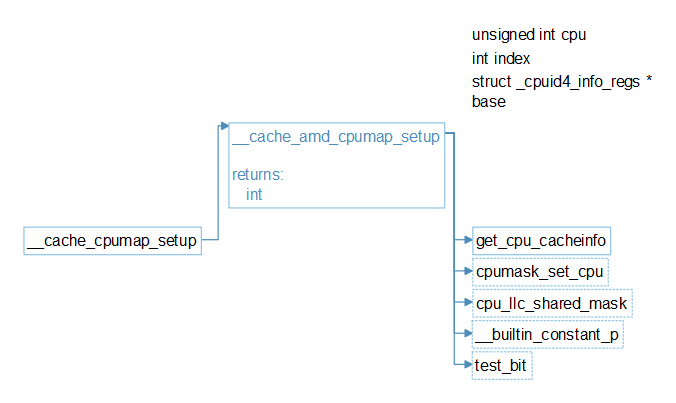
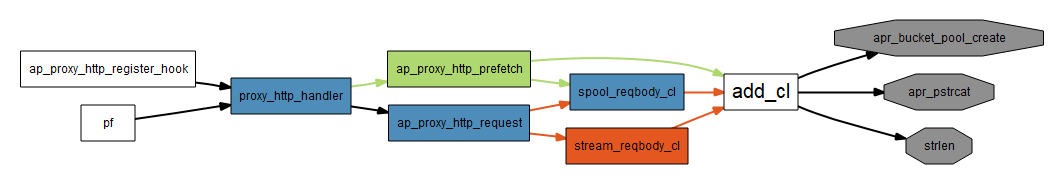
Call Trees
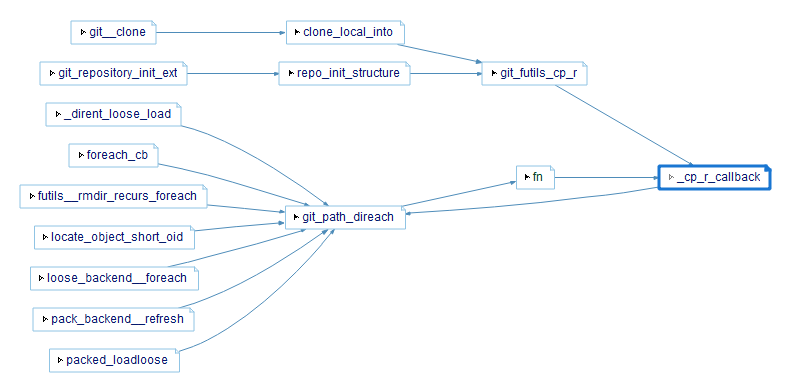
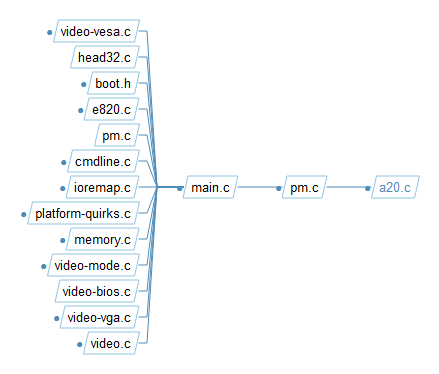
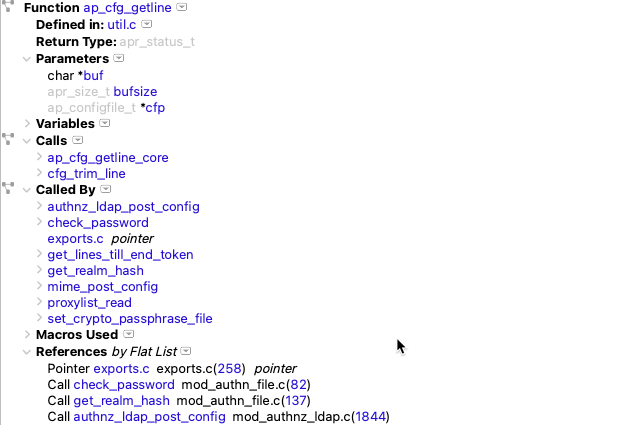
Call-By Trees
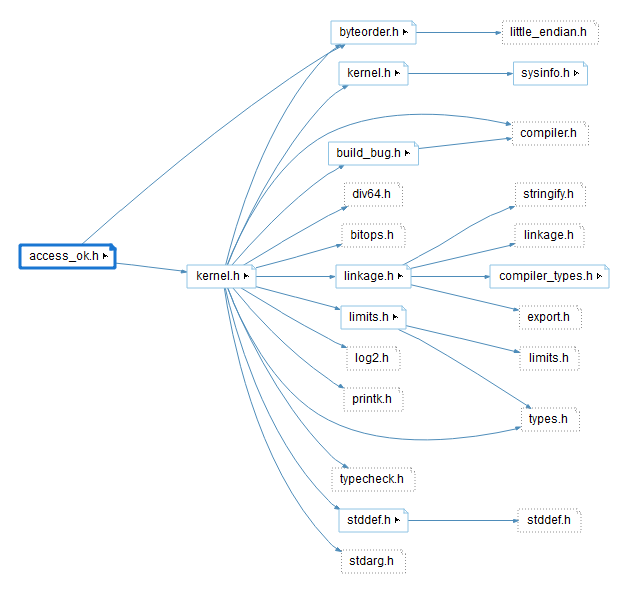
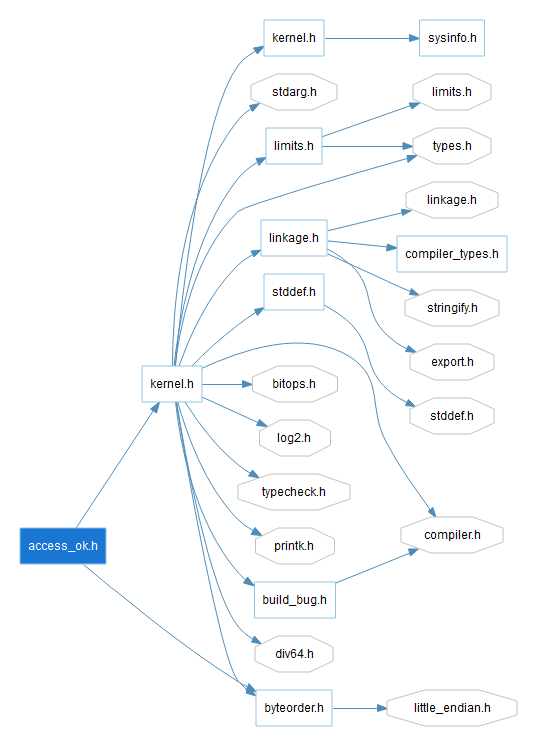
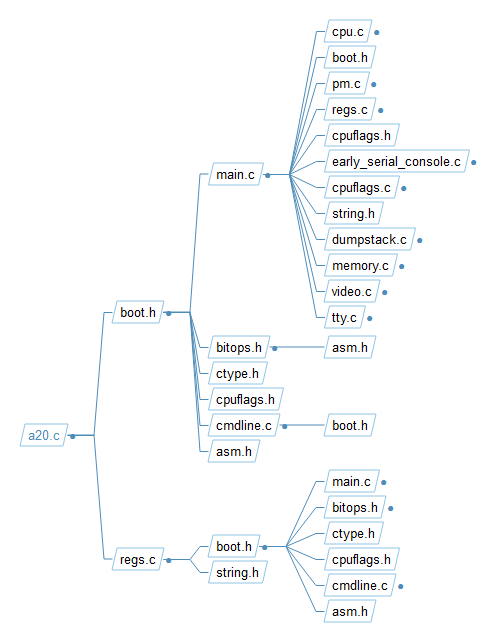
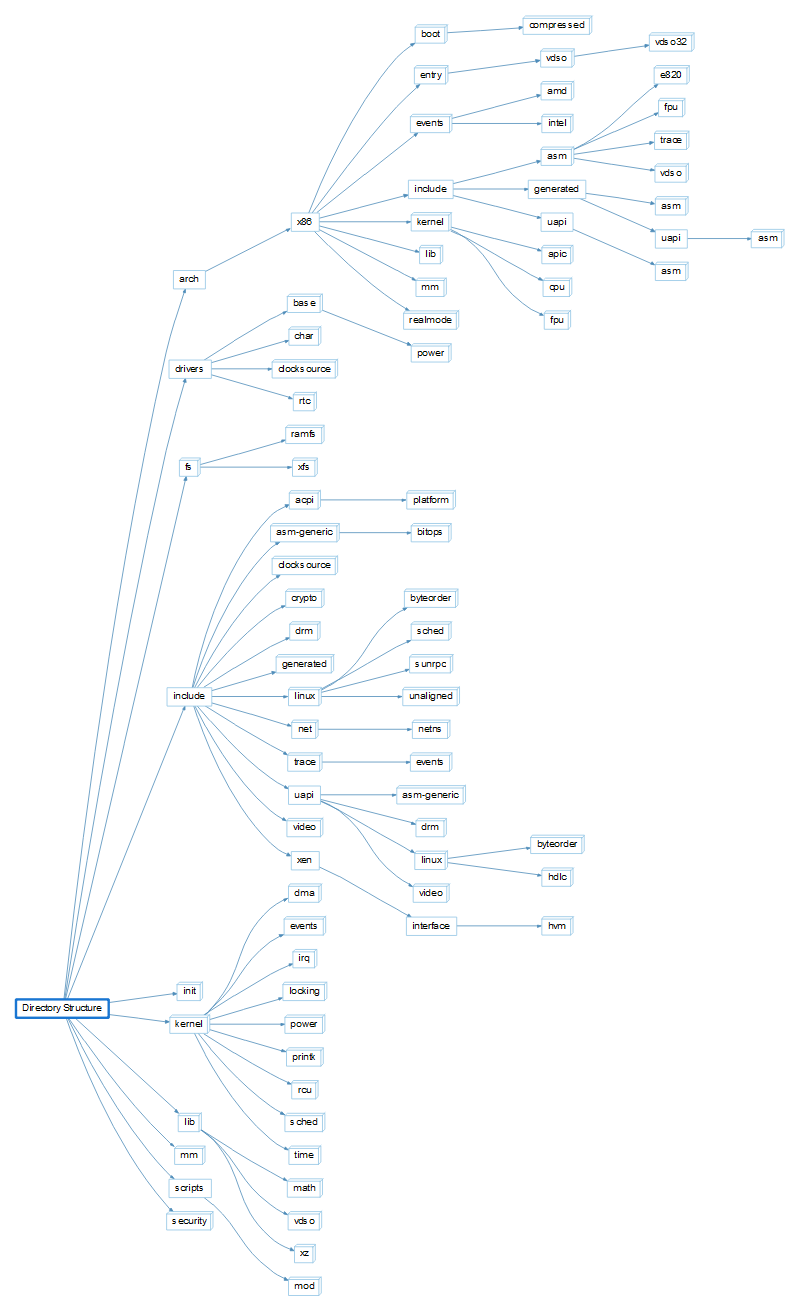
Include Tree
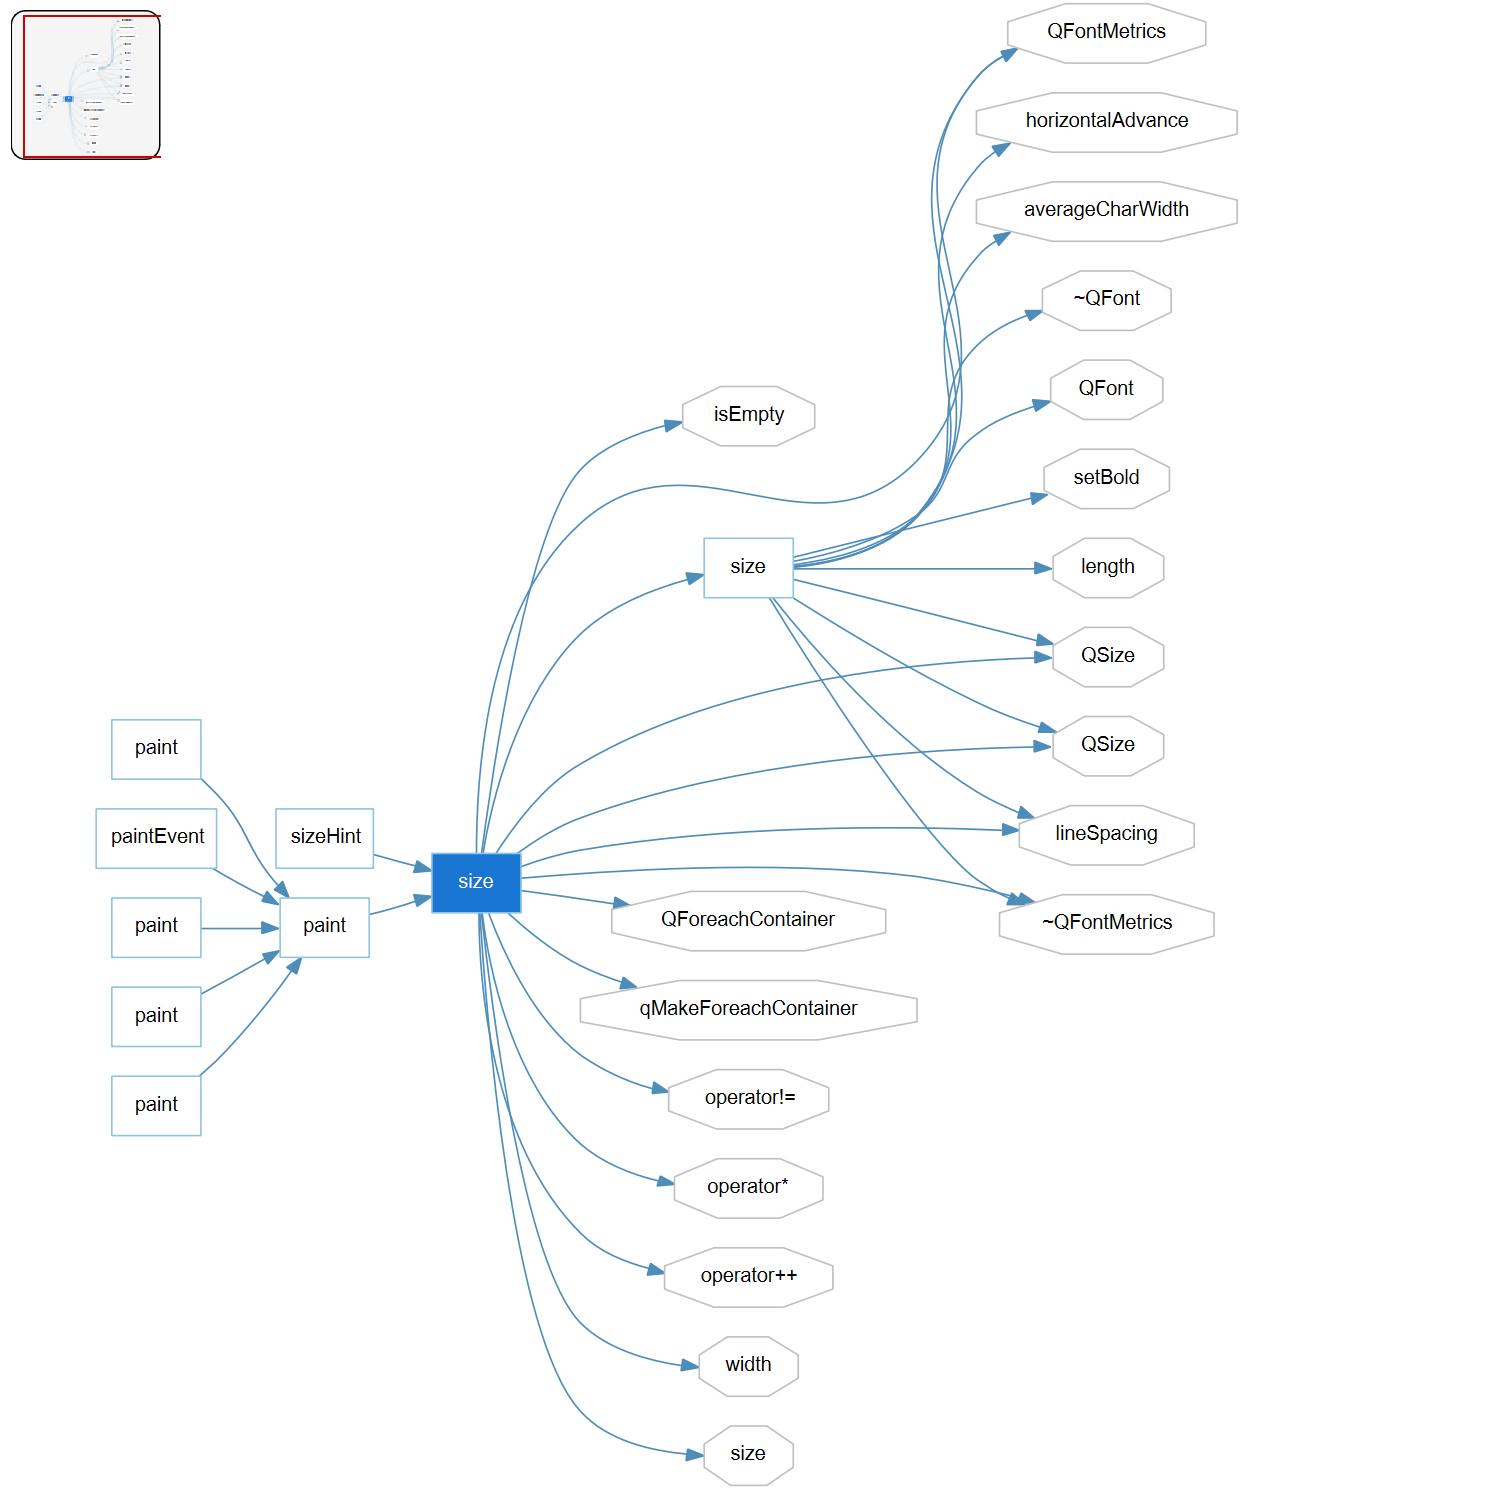
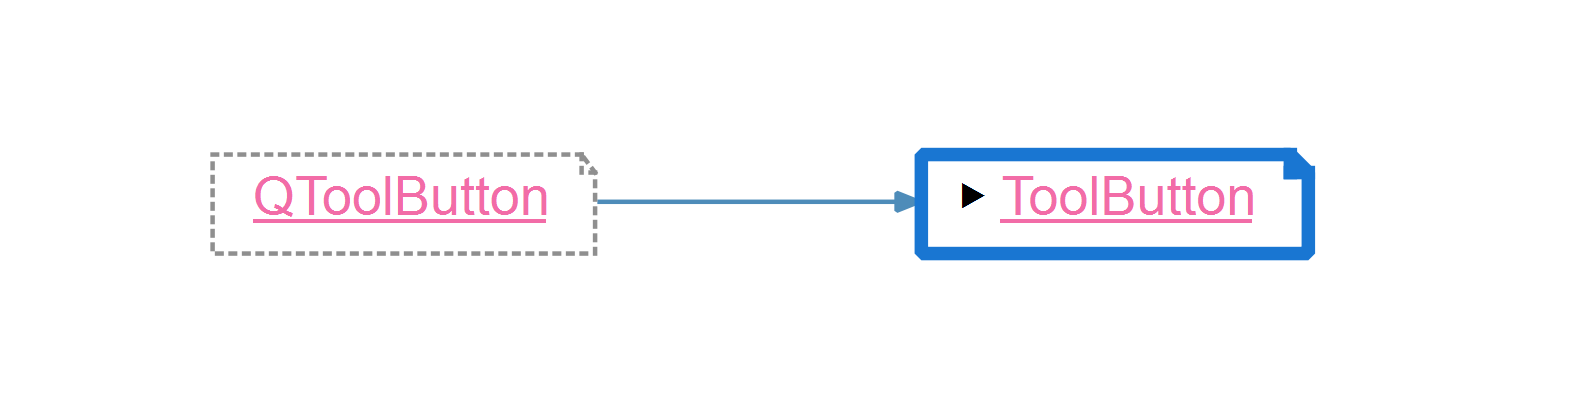
Butterfly Graph
The butterfly graph shows the most important relationship for the kind of entity you select. For functions and methods, it shows both the call and call by trees. However, for a class, it will show the inheritance tree, and for files, it will show the include tree
Declaration Graphs
Depends On and Depended on By
Data Members
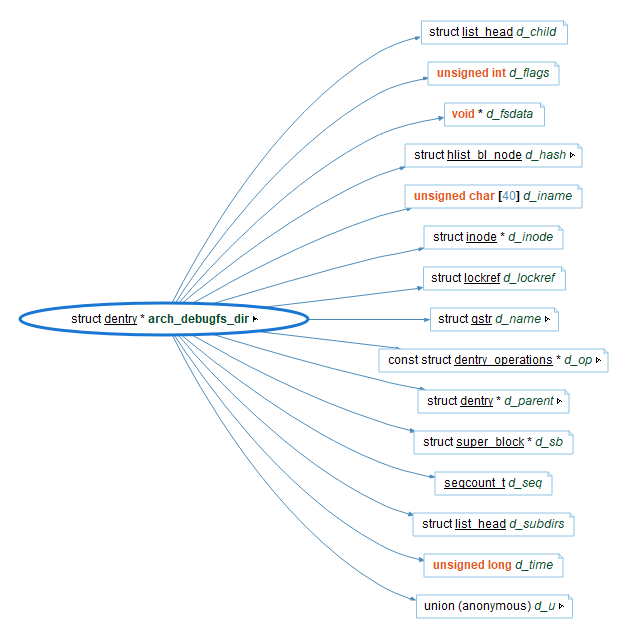
Object References
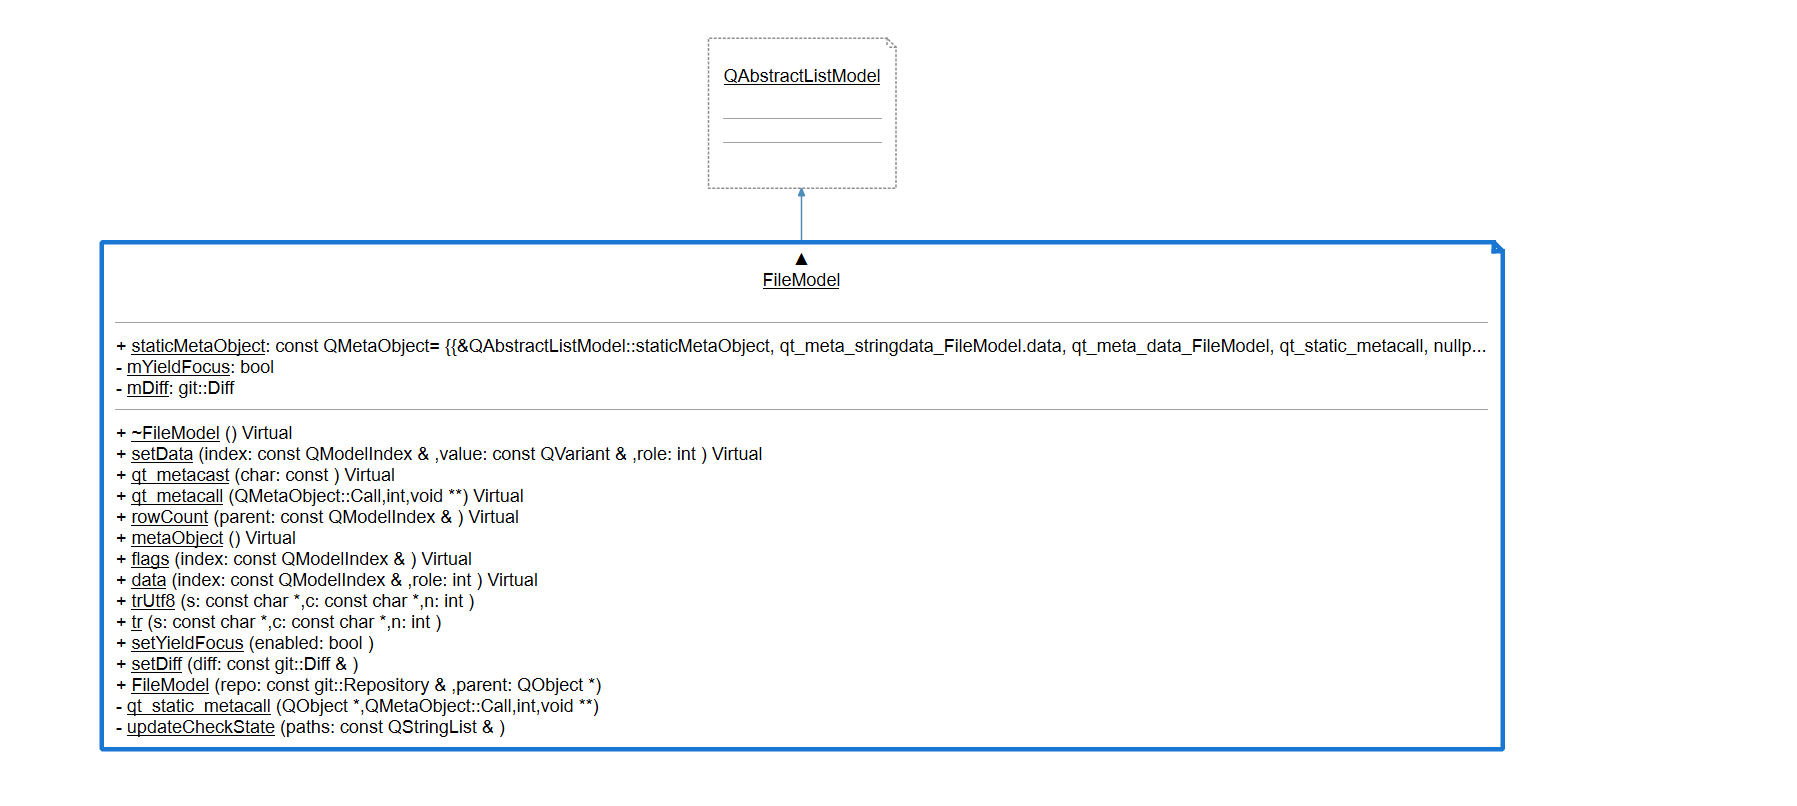
UML Class Diagram
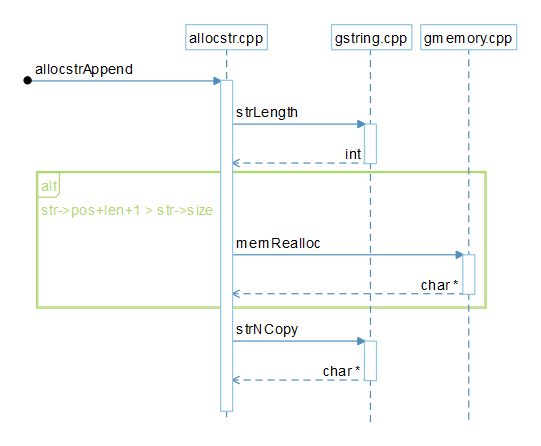
UML Sequence Diagrams
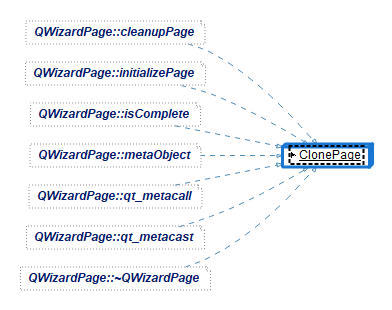
Overrides
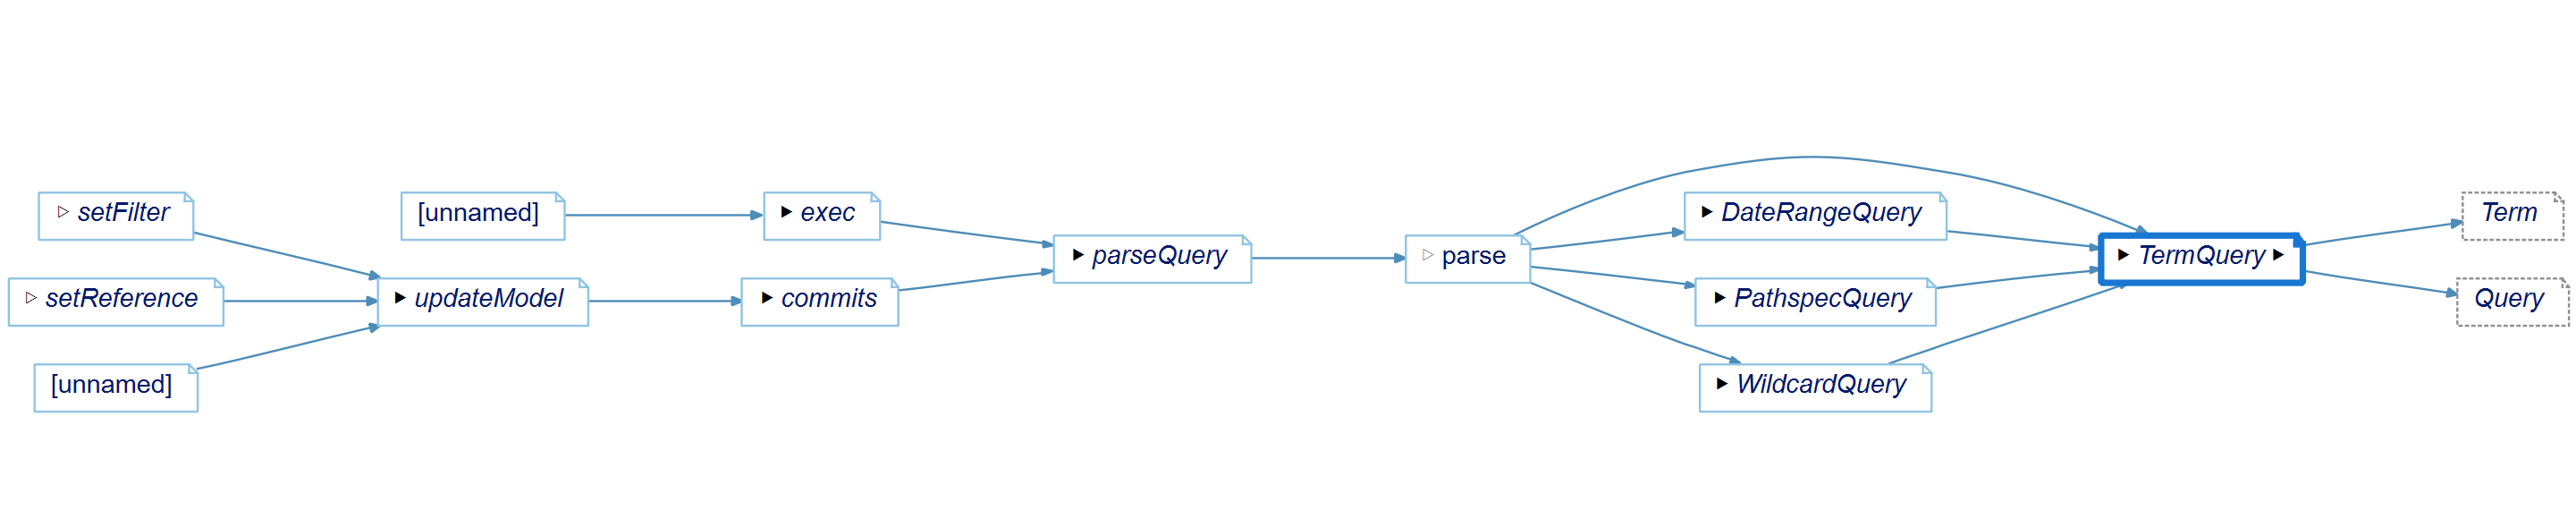
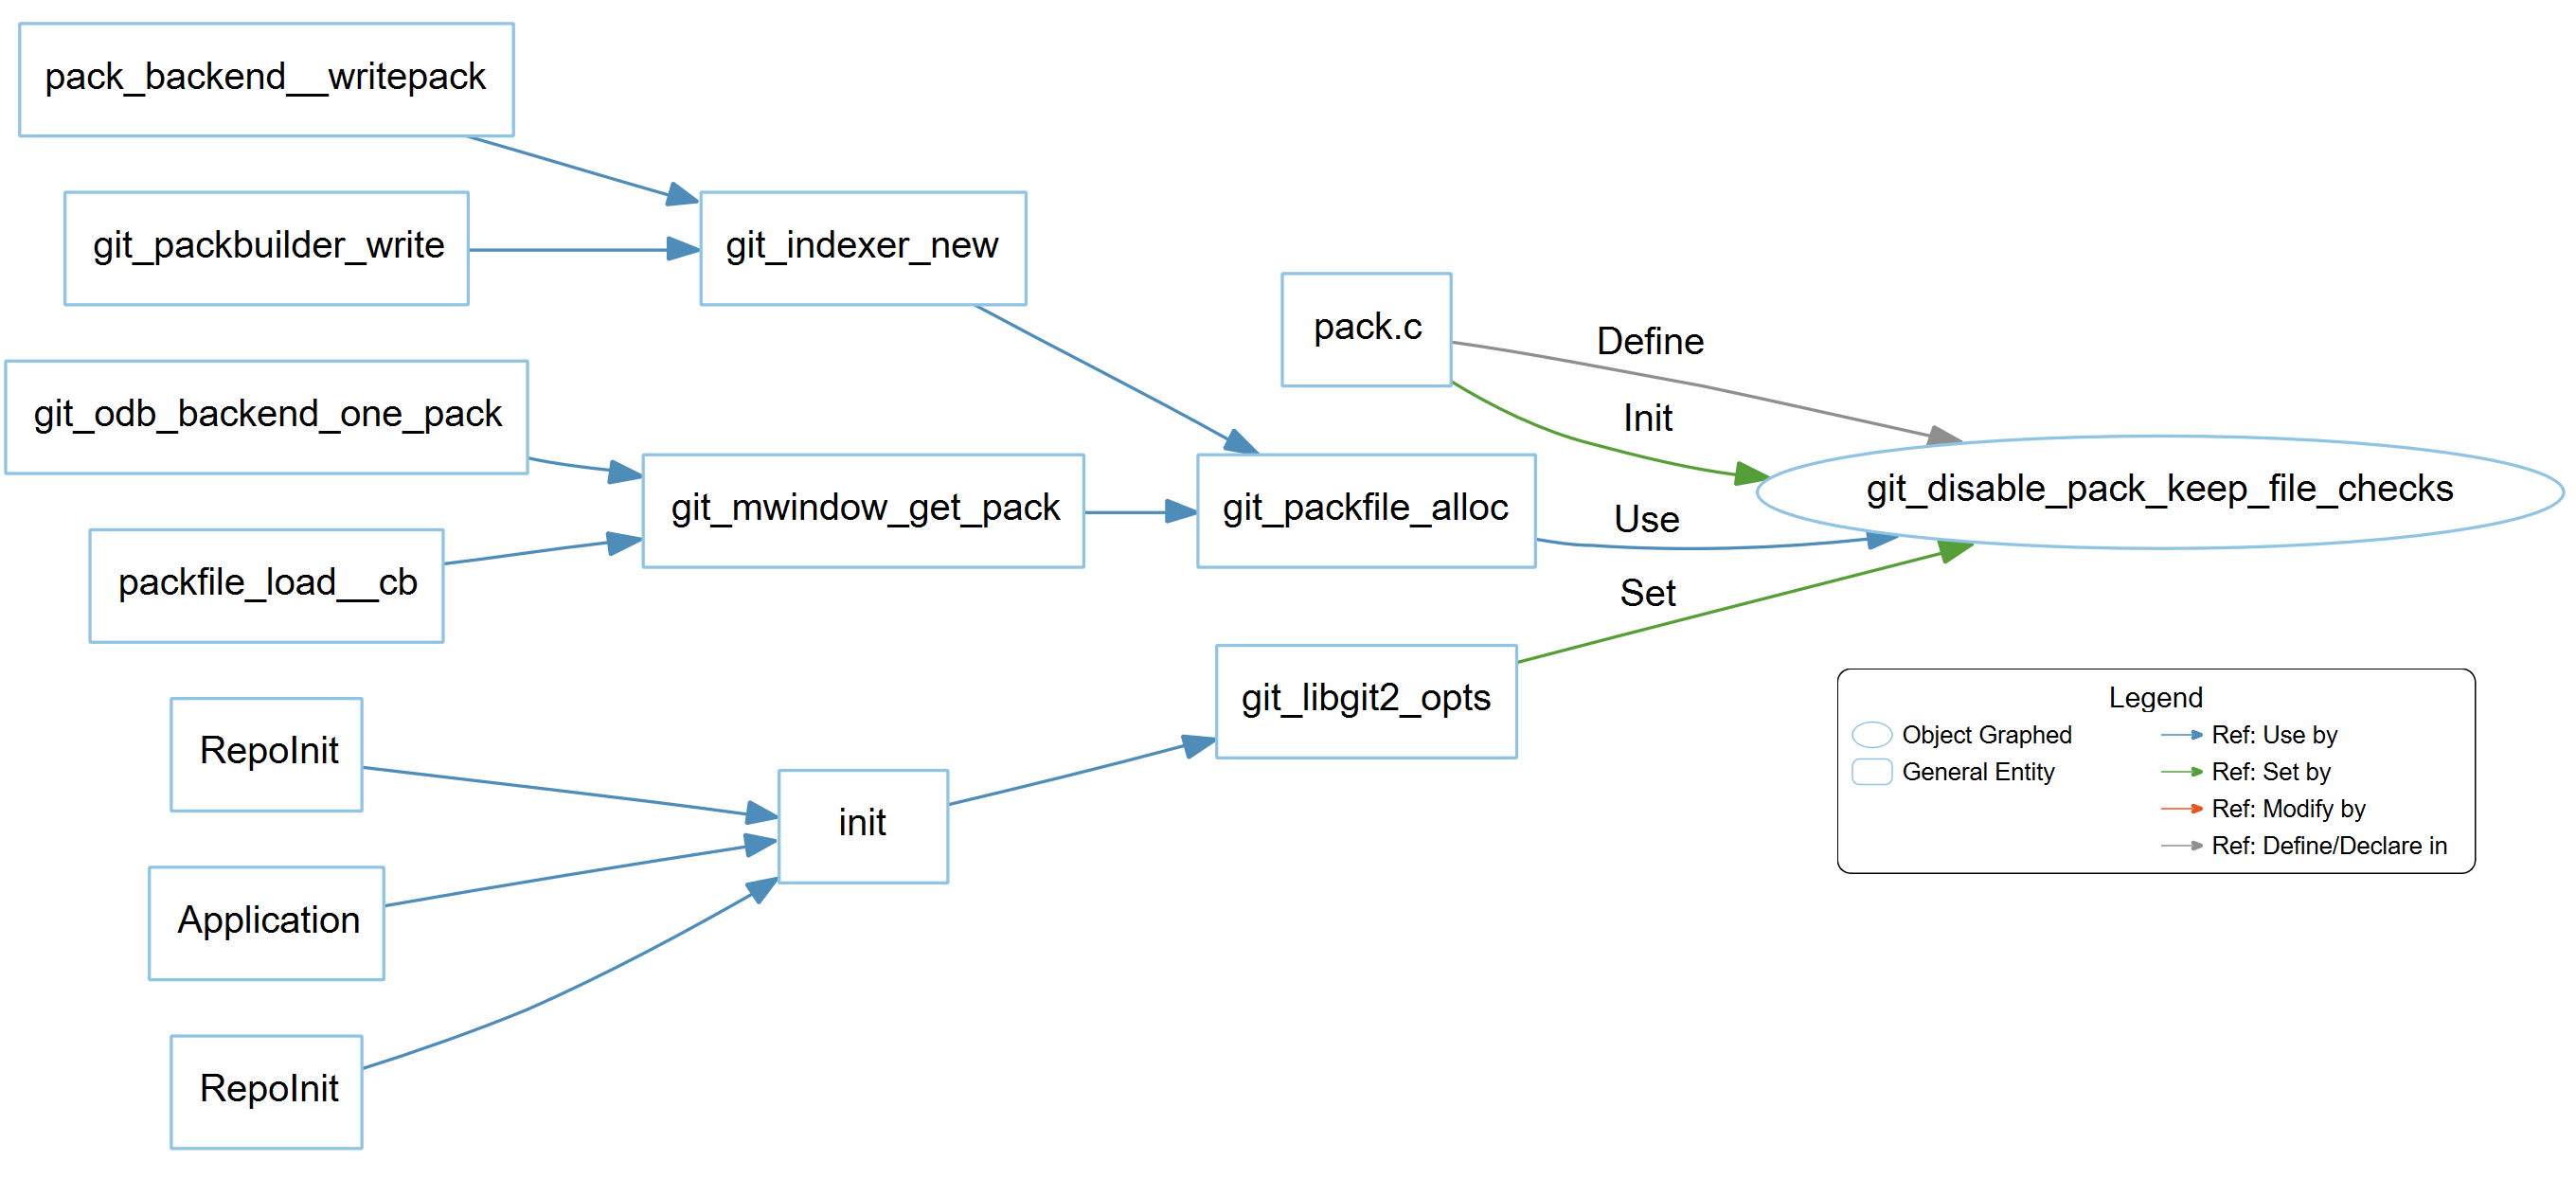
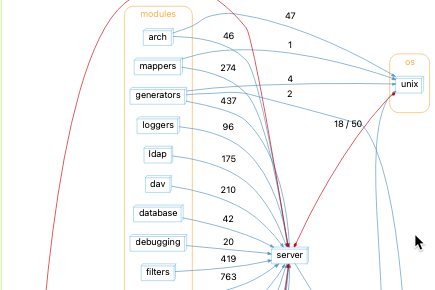
Dependency Graphs
These project-level interactive graphs let you explore how the different parts of the code rely on each other. This example from git has more details here.
Base and Derived Graphs
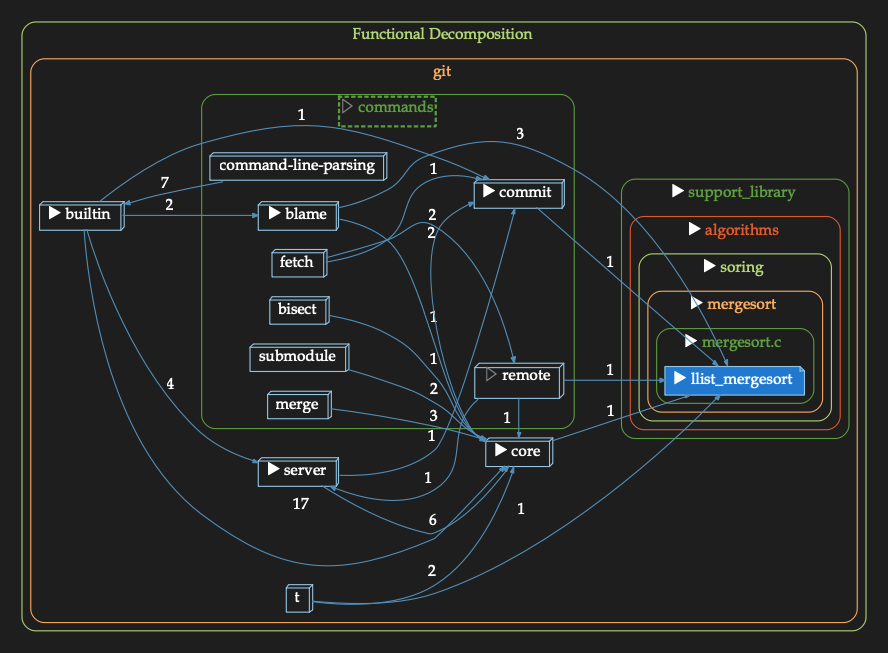
Architecture Graphs
These graphs let you explore how the code files are currently arranged or create new architectures that help better understand how the code is logically put together.
Compare – Butterfly Graph
Compare graphs let you identify how code has changed between two versions of the same project
Compare – Control Flow
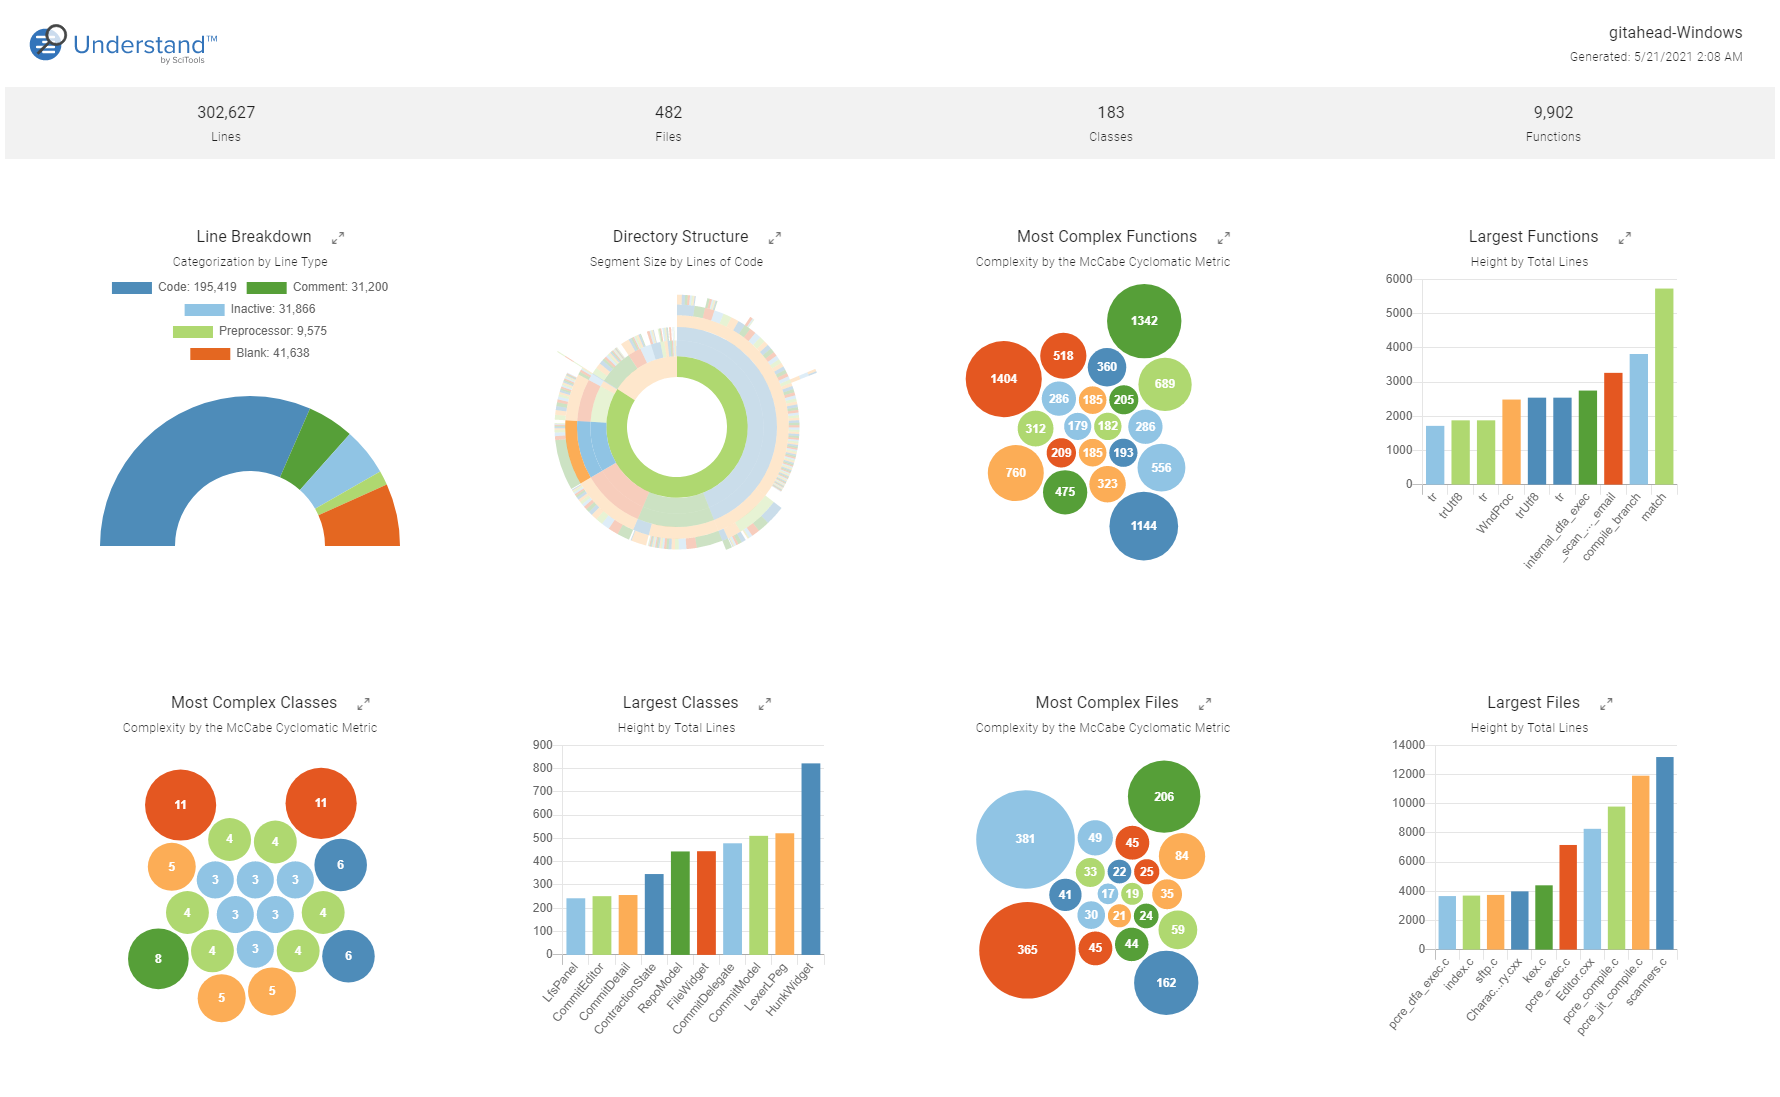
Project Overview Graphs
These graphs show high-level information to help you get a sense of what’s going on in the project.
- Line Breakdown shows how many lines of code, comments, inactive, preprocessor, and blank lines your project has
- Directory Structure sunburst graph shows how much code is in each directory
- The Most Complex Functions, Most Complex Classes, and Most Complex Files are all based on McCabe Cyclomatic Complexity and let you quickly see the hot spots in your code
- The Largest Functions, Largest Classes, and Largest Files are based on the line count and also help you focus on important regions
Custom Graphs
If you need something different that we already offer, Understand also allows you to create your own graphs using our APIs.
If you’re interested, you can also read about how we’ve tried to make graphs more interesting.
Do you have solutions for Ruby? If not, any recommendations?
Unfortunately we don’t have any experience with Ruby currently. We’ll add a vote for Ruby as the next language that we include and send out an update when that happens!