
Abstract: Learn about new graphs and metrics to see comparisons and how architectures or entire projects have changed.
Recently I asked Claude what had changed between two versions of a Java project. Claude told me that two packages had been completely refactored. Since I needed to be sure this report was accurate, I set out to verify it in Understand.
Unfortunately, Understand didn’t quite have the views I was looking for. The Change Locator is great for listing entities, but I needed to see how the entire project had changed. So, it was time to add some new views (All of the views in this post are available starting in Understand 8.1).
New Metrics
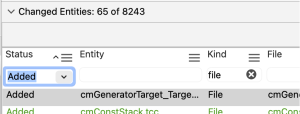
The first thing I wanted was a count of new, removed, and changed files. It’s possible to get this from the Change Locator, though it’s not fast. Set the Kind filter to “file” and then change the status filter to each option. The filtered count at the top shows the value. I will use a CMake example here as I can’t share the Java project I’m working on. In the following image, I can see there are 65 new files in the CMake sample project:
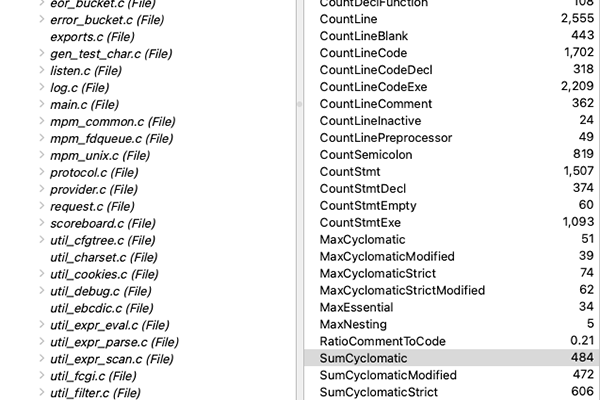
The same could be done for other kinds (classes, functions, etc). But why should I have to do that manually? I’ll add metrics for it. Going a step further, with the new Metric Browser, I’ll add a “Comparison Summary” view to just give me the summary of what changed. Here’s how it looks for CMake when comparing two different versions:
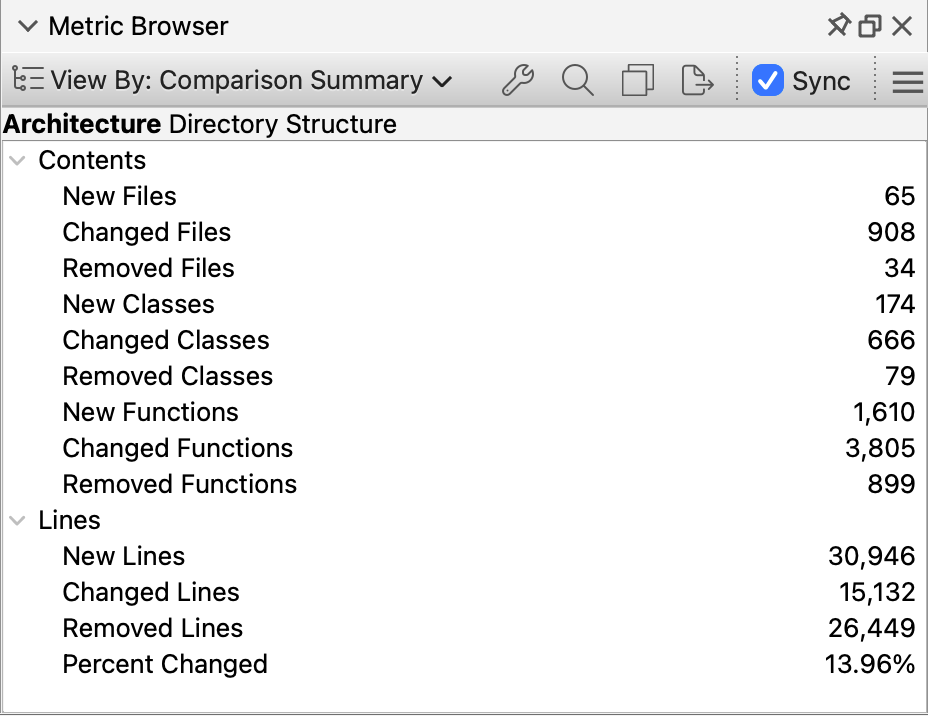
While I’m supporting comparison metrics for architectures anyway, let’s make the comparison line count metrics (New, Changed, and Removed Lines, and Percent Changed) work at an architecture level too. They’ll propagate up just like built-in line metrics, summing over each entity. Then I can get a percent changed value for the entire project. CMake is 14% changed.
For architecture metrics, note that an entity might be added or removed with respect to the architecture even though it wasn’t added/removed for the project. For example, suppose a custom “Files to Review” architecture that contained “X.cpp” for the comparison project but not for the current project. Even if X.cpp didn’t change, for “Files to Review”, it will count as a removed file and its lines will count as removed lines.
Dependencies Comparison Graph
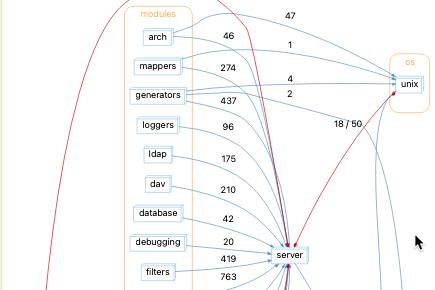
Metrics tell me what changed. Now I want to see how that changes my project. So, I’ll make an Architecture Dependencies comparison graph variant. CMake is a bit inconvenient with this particular graph because its Source folder directly holds 773 files and that’s too much for the layout algorithm. I’ll turn off “Show Entities” so the layout is faster.
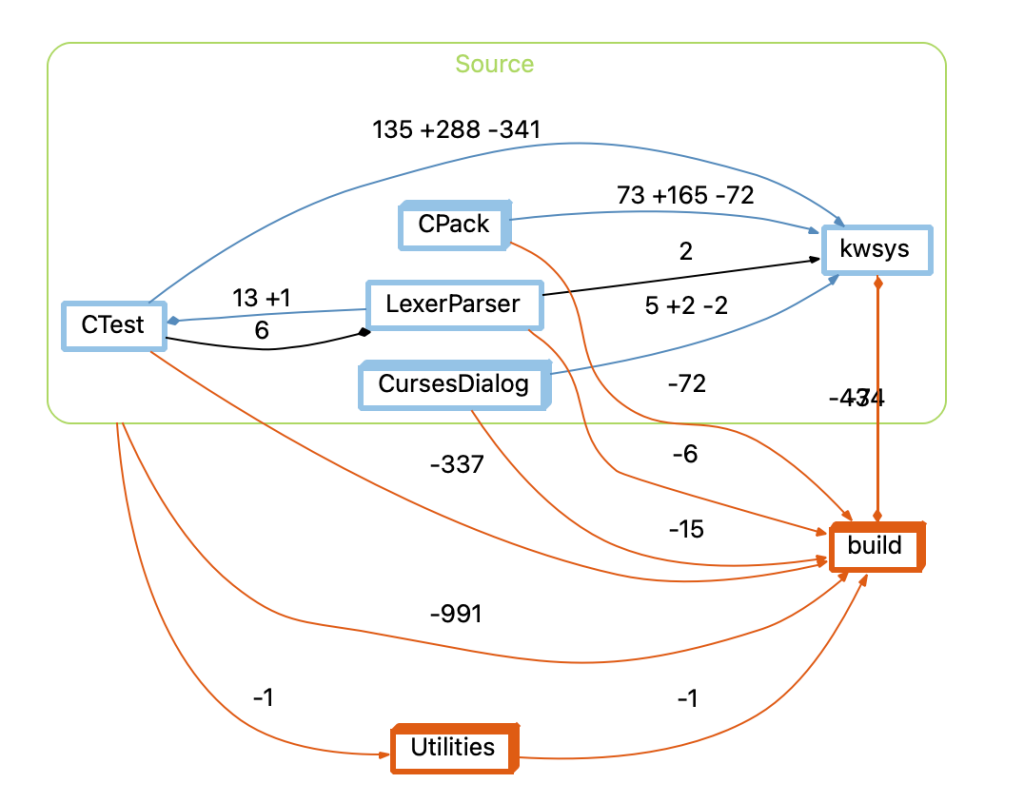
Nice. From the comparison graph I can see that the old project had “Utilities” and “build” folders that aren’t part of the current project. Every folder in Source is changed (which I know since they all have bolded outlines). But most relationships didn’t change much. For example, LexerParser has one new dependency into CTest but the other 13 stayed the same, and the CTest to LexerParser dependency also stayed the same. The biggest changes seem to be CTest and CPack’s dependencies to kwsys.
File Dependencies Comparison Graph
I mentioned that CMake has too many files in Source to work well with the Architecture Dependencies graph layout. Luckily, there is a layout designed to handle lots of nodes even with cycles. It’s used by the File Dependencies graph. So, I’ll add a Compare variant for the File Dependencies graph too.
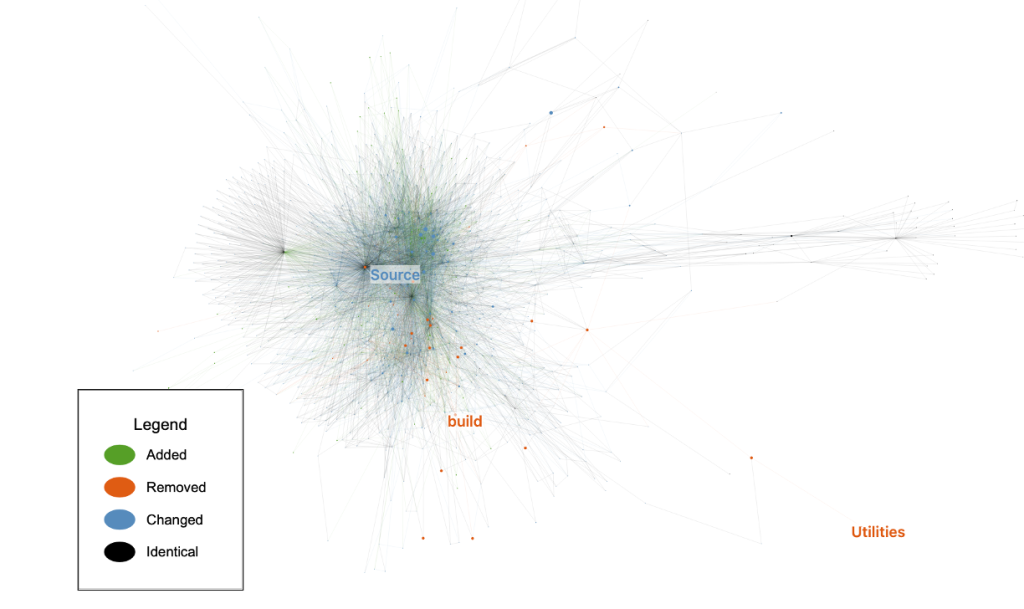
At the scale of an entire project, this graph mostly confirms what you’d expect: when every file lands in one big cluster, the dependencies are a hairball, compared or not. The comparison graph gets much more useful when you narrow the scope. Since it works on any architecture node, I tried it on some of the Functional Decomposition architecture’s children. Here’s an interesting one: “Package Discovery” has a group of new files that are completely independent from the changed files.
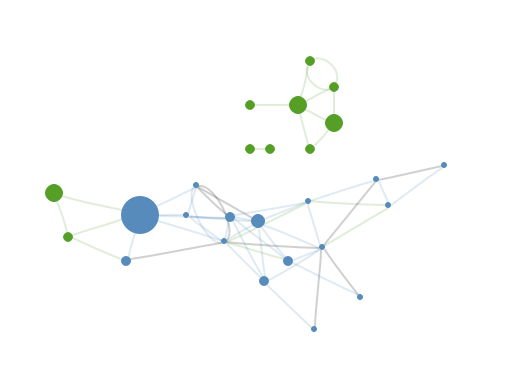
Note that for this graph, an entities change status is its project change status, not its status relative to the architecture. That was a design decision because the architecture only determines which files go into the graph. Even if a file appears more than once in an architecture (or would be added from one child and removed from another) it still only gets drawn once. So rather than picking an arbitrary change status for files that moved, the project change status is used. For the “Package Discovery”, since the “Functional Decomposition” architecture doesn’t exist in the comparison project, all the files are technically added relative to the architecture. But the graph uses the project change status, so only files new to the project are shown as new.
Architecture Comparison Graph
So far we’ve covered what changed with metrics, and how that impacted dependencies with the Dependencies and File Dependencies Graph. But what about where the changes are? I suppose the File Dependencies Graph can answer that if it’s not too tangled. But let’s make a Compare variant for the Architecture graph too. It’s nice to be complete.
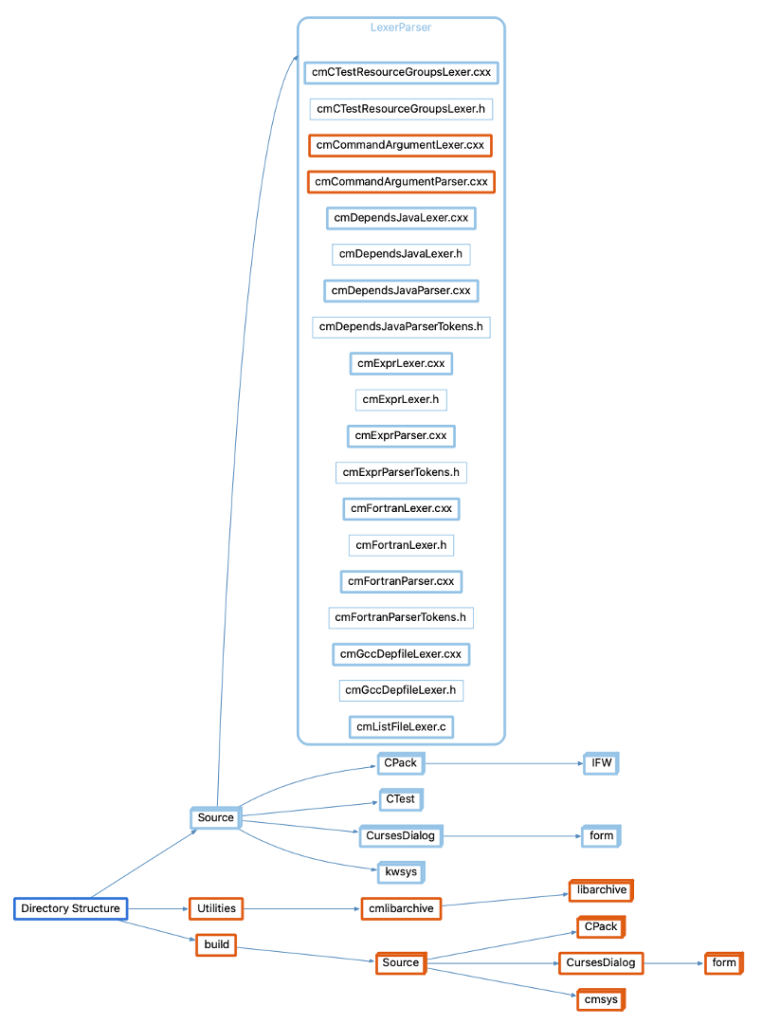
As expected from the Dependencies Comparison Graph, all the nodes turn out to be changed or removed. But now it’s possible to expand them to see how they’re changed. For example, I know from the Metric Browser that LexerParser has 2 removed files and 9 changed files. With the graph, I can quickly see exactly which files are the removed and changed ones.
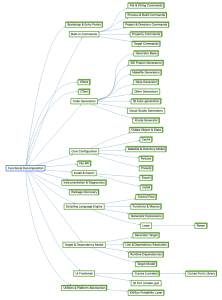
Like the Dependencies comparison graph and metrics, this graph uses the entity’s status relative to the architecture. So, “Functional Decomposition” is all new:
Conclusion
So, for the Java project I started with, was Claude right? Yes, two packages had been completely redone, which the Architecture Comparison graph confirmed. But they were also renamed in the process. So how much of them really changed? If you’d like to see rename detection in Understand, let us know.