Abstract: How to make an architecture graph plugin using Understand’s API.
Understand has a lot of built-in graphs but every user is unique. At some point, you might want a graph that Understand just doesn’t have. That’s where the Understand API comes in. You can write your own custom graph plugin in Python.
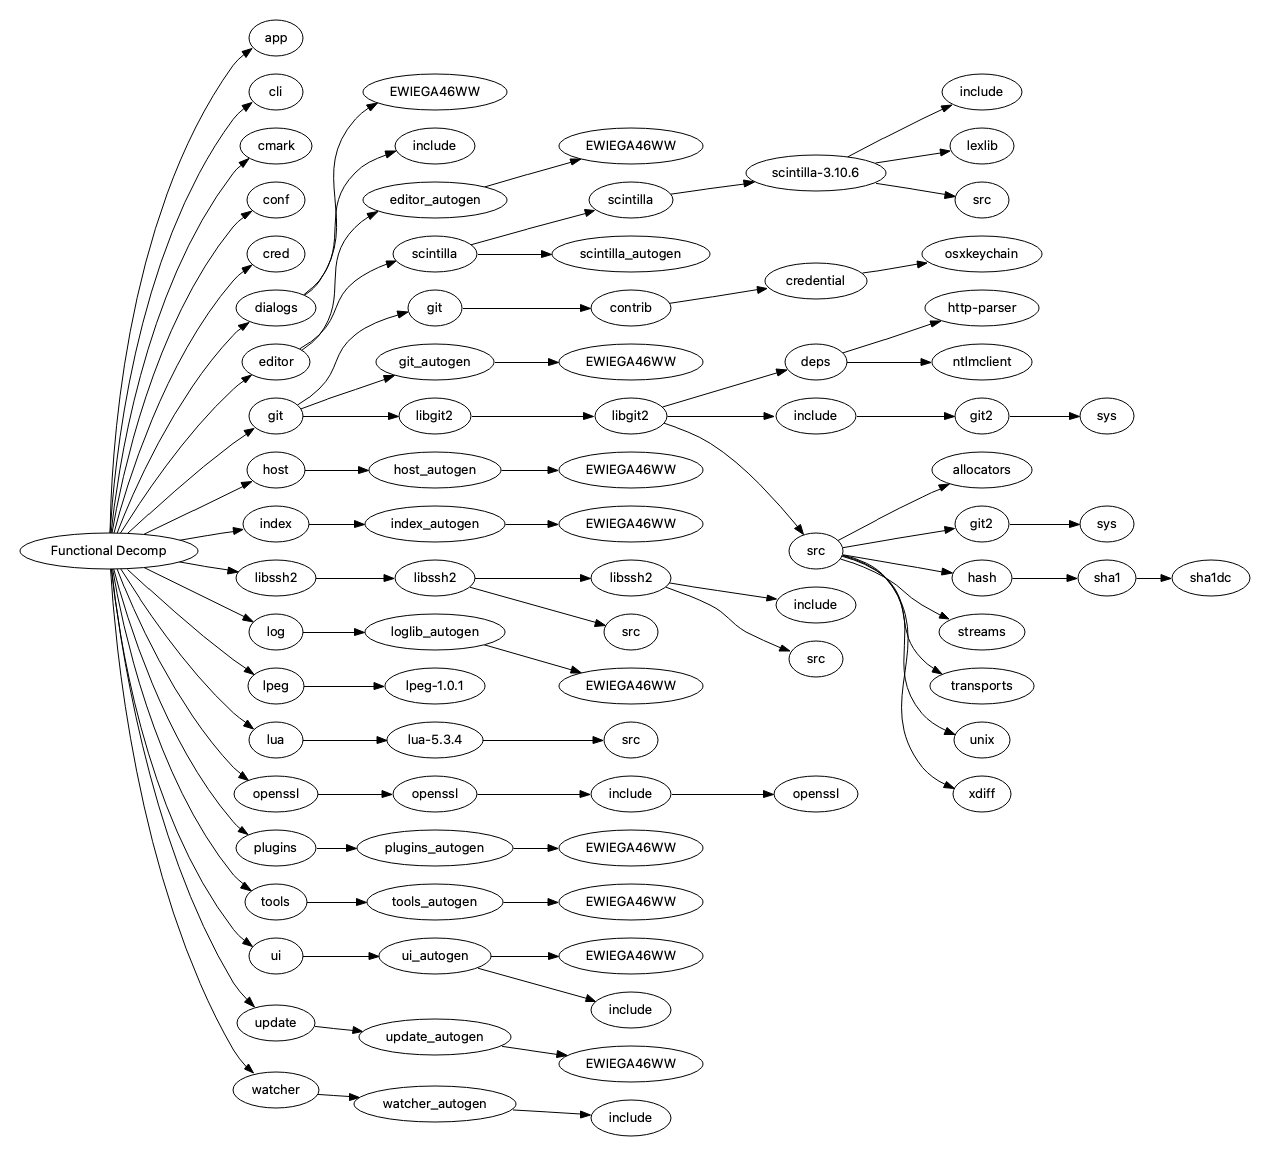
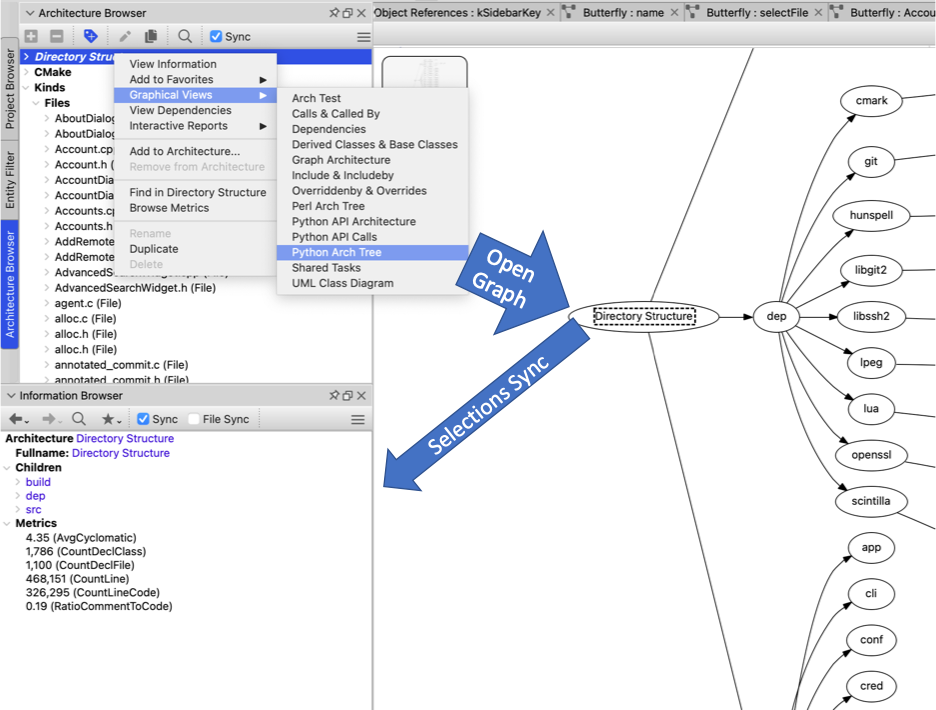
Custom graphs have been limited to an entity or the whole project as the starting point. Now, however, you can make a custom graph plugin for an architecture. This article describes how to do so in Python, you can download the plugin here
Python Code
Like any graph plugin, an architecture graph plugin requires a name. This is the name that will be part of the Graphical Views menu for an architecture.
def name():
  """
  Required, the name of the graph.
  """
  return "Python Arch Tree"
Next, graph plugins define when the graph is available. In the past, there were only two test functions: test_entity and test_global. Now there’s a third one for architectures: test_architecture. If the functions are not defined, they are assumed false. So, this plugin can just define test_architecture.
def test_architecture(arch):
  """
  Optional, return True if the graph exists for the given architecture

  If True, this graph will appear in the Graphical Views menu for the
  architecture.
  """
  return True;
If the graph had options or a legend, it would be necessary to define them in an init function. This graph plugin doesn’t require them so that function can be skipped. The last required function is the draw function. The draw function provides the nodes, edges, and clusters in the graph. The layout is then done by Graphviz.
For an architecture tree, edges connect parents to children. Since there are no cycles in an architecture hierarchy, keeping track of visited nodes is unnecessary.
def draw(graph, target):
  """
  Draw the graph

  The second argument will be an architecture since only test_architecture
  returns True
  """

  graph.set("rankdir", "LR")

  # store the arch->graphviz node so that each arch node appears only
  # once no matter how many edges
  nodes = dict()

  curLevel = []
  curLevel.append(target)

  while curLevel:
    nextLevel = []
    for arch in curLevel:
      tail = grabNode(graph, nodes, arch)
      for child in arch.children():
        edge = graph.edge(tail,grabNode(graph,nodes,child))
        nextLevel.append(child)
    curLevel = nextLevel
The draw function relies on grabNode function so that the same node is used for both edges in and edges out:
def grabNode(graph, nodes, arch):
  """
  This is a custom function for this script to get a graphviz node
  """
  if arch in nodes:
    node = nodes[arch]
  else:
    node = graph.node(arch.name())
    node.sync(arch); # architectures must be synced instead of given at creation
    nodes[arch] = node

  return node
To install the graph plugin, drag the file onto an Understand editor. You’ll get a prompt to edit or install. Select install. Or, you can copy the file to the correct location yourself, as described in this article. Then the graph will appear in the Graphical Views sub menu. Selected architecture nodes sync to the information browser.