Abstract: Creating a sample Understand graph plugin to draw a call tree using the Python API.
Understand provides a lot of graphs, but sometimes they might need a little customization. The ability to write a custom graph plugin using Perl has existed for a long time. Now, you can also write graph plugins in Python! Let’s walk through writing a simple call tree graph.
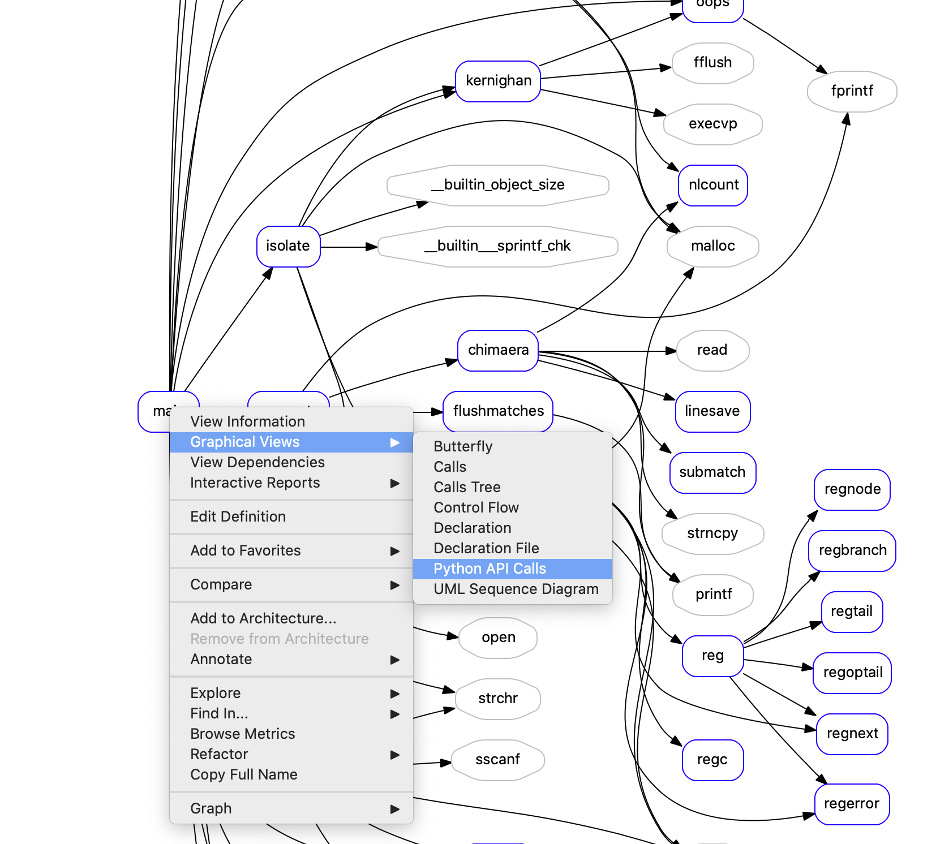
The first thing your graph plugin will need is a name. This is the name that appears in the Graphical Views context menu. You can choose to name it the same as an existing graph (“Calls” for example) and then it will appear as a variant of the “Calls” graph named “Custom.” Here’s an example of the name function:
import understand

def name():
  """
  Required, the name of the graph.
  """
  return "Python API Calls"
The next step is to define when this graph is available. A graph can be a project-level graph that takes the database as input or an entity-specific graph. It can even be both. The functions test_entity and test_global are used to see when the plugin is available. For this example, let’s make our graph available for function entities and for the project as a whole:
def test_global(db):
  """
  Optional, return True if this graph is a project level graph

  If True, this graph will appear in the top level Graph Menu.
  """
  return True

def test_entity(ent):
  """
  Optional, return True if the graph exists for the given entity

  If True, this graph will appear in the Graphical Views menu for the
  entity.
  """
  return ent.kind().check("function ~unknown ~unresolved");
If your graph has options, they need to be defined in the init function. The init function takes an understand.Graph object as an argument. You can use the graph object to access the options and the legend. For this example, I’ll define two options. The first one is the depth of the call tree. The second one is a style option controlling whether nodes have a fill color. To show off my fancy style option, I’ll add a legend entry for a function node. It’s ok if it’s not accurate now. I can update the legend later based on the “Fill” option’s value.
def init(graph):
  """
  Initialize the graph

  This function is called once on graph creation. Use it to define the
  available graph options and/or a legend.
  """
  # Define options through the options object
  graph.options().define("Depth", ["1", "2", "3"], "3")
  graph.options().define("Fill", ["On","Off"], "Off");

  # Defining a legend is optional. You can add multiple entries to the legend.
  graph.legend().define("func", "roundedrect", "Function", "blue", "#FFFFFF")
The main part of the plugin is the draw function. The draw function takes in the same understand.Graph object given to init and the target. The target is either an understand.Db or an understand.Ent depending on if the graph is project level or entity level.
The draw function needs to define the nodes, edges, and clusters in the graph. Then the graph will layout will be done by Graphviz. The understand.Graph object is the root of the Graphviz Graph. It has node, edge and cluster methods to create new nodes, edges, and clusters. On any of the Graphviz objects, the set method allows setting Graphviz attributes such as the shape or color.
For the first part of the draw function, I’m going to set the default Graphviz attributes for the graph. I need to respect the “Fill” option I defined, and update the legend accordingly:
def draw(graph, target):
  """
  Draw the graph

  The second argument can be a database or an entity depending on whether
  the graph was created at a project level or entity level.
  """

  fore = "blue"
  back = "#FFFFFF"

  # Use options to lookup the current values
  if graph.options().lookup("Fill") == "On":
    fore = "#000000"
    back = "blue"

  # Use set to update the legend outside of init
  graph.legend().set("func","fore",fore)
  graph.legend().set("func","back",back)

  # Use set to change graph, node, and edge attributes
  graph.set("rankdir", "LR")

  # Use default to set the default attributes for graphs, nodes, and edges
  graph.default("color", fore, "node")
  graph.default("fillcolor", back, "node")
  graph.default("style","filled,rounded","node")
  graph.default("shape","box","node")
To draw a call tree, I need to know the start entity or entities. If the target is an entity, then I’ll use it as a start entity. For a project-level graph, I’ll start with all the entities and use a depth of 1.
  # If the graph is both project level and entity level, use isinstance
  # to determine the type
  depth = 1
  curLevel = []
  if isinstance(target, understand.Db):
    # This sample graphs all functions in the database for a project level
    #graph
    curLevel = target.ents("function ~unknown ~unresolved")
  else:
    # For an entity level graph, generate a calls tree
    curLevel.append(target)
    depth = int(graph.options().lookup("Depth"))
I want each entity to only appear once in the graph, so I need to store the node I create for each entity. I’ll store them in a nodes dictionary. I also want to avoid expanding the same entity twice, so I’ll track my visited entities with a visited set. Now, I just need to loop over the entities and add an edge for each call reference:
  # store the ent->graphviz node so that each entity node appears only
  # once no matter how many calls to it there are.
  nodes = dict()

  # avoid visiting any node more than once
  visited = set()

  # Loop over the levels of the tree
  while depth > 0:
    depth -= 1
    nextLevel = []
    for ent in curLevel:

      # avoid visiting nodes multiple times
      if ent in visited:
        continue
      visited.add(ent)

      # Get a graphviz node for the entity
      tail = grabNode(graph,nodes,ent)

      # Add edges for each call
      for ref in ent.refs("call",unique=True):
        headEnt = ref.ent()
        nextLevel.append(headEnt)
        head = grabNode(graph,nodes,headEnt)

        # create an edge
        edge = graph.edge(tail,head)
        # Use sync so that clicking on the edge will visit the reference
        edge.sync(ref)
    curLevel = nextLevel
I’ve also written a grabNode function to create nodes as I need them. This lets me customize the node appearance based on the entity attributes. In this case, I’ll make unresolved functions appear as gray-bordered octagons.
def grabNode(graph, nodes, ent):
  """
  This is a custom function for this script to get a graphviz node
  """
  if ent in nodes:
    node = nodes[ent]
  else:
    # passing an ent to the node object will automatically sync the entity.
    node = graph.node(ent.name(),ent)

    if ent.kind().check("unresolved"):
      # Set graph, node, and edge attributes with the set function.
      # See Graphviz documentation for available attributes.
      node.set("shape","octagon")
      node.set("color","gray")
      node.set("fillcolor","white")
    nodes[ent] = node

  return node
The final step is to install the script so Understand can find it. The script should end with a “.upy” extension so that Understand knows it’s a python plugin. Then, dragging the script onto the Understand editor will give an option to install it. There are also directions here for where to place plugins. With the plugin installed, I can access it through the menus to draw my custom graph. Voila!