Abstract: Have a question about your code? Learn about the available metrics in Understand, the ways to explore them, and how they can help you solve problems.
I have a scorpion problem. Scorpions seem to hate me in particular, but how can I convince my pest control service of that? Hopefully, you don’t have a scorpion problem, but likely you have other problems. How do you convince your boss that you’re being a productive programmer? How do you decide how much time a programming task will take you? How do you prioritize which area of your code needs refactoring the most?
While you could make your case poetically, generally numbers are more convincing. Understand can help you get the numbers you need for your programming-related problems. In Understand, the numbers are called metrics. Metrics can be broadly split into two categories, quantity metrics, and quality metrics.
Quantity
Quantity metrics express how much of something there is. To express the magnitude of my scorpion problem, I could start by telling you that I have found 50 scorpions inside my house since I moved in. Similarly, Understand can tell you how big your project is. Many quantity metrics are summarized on the Welcome Page when you first open Understand.
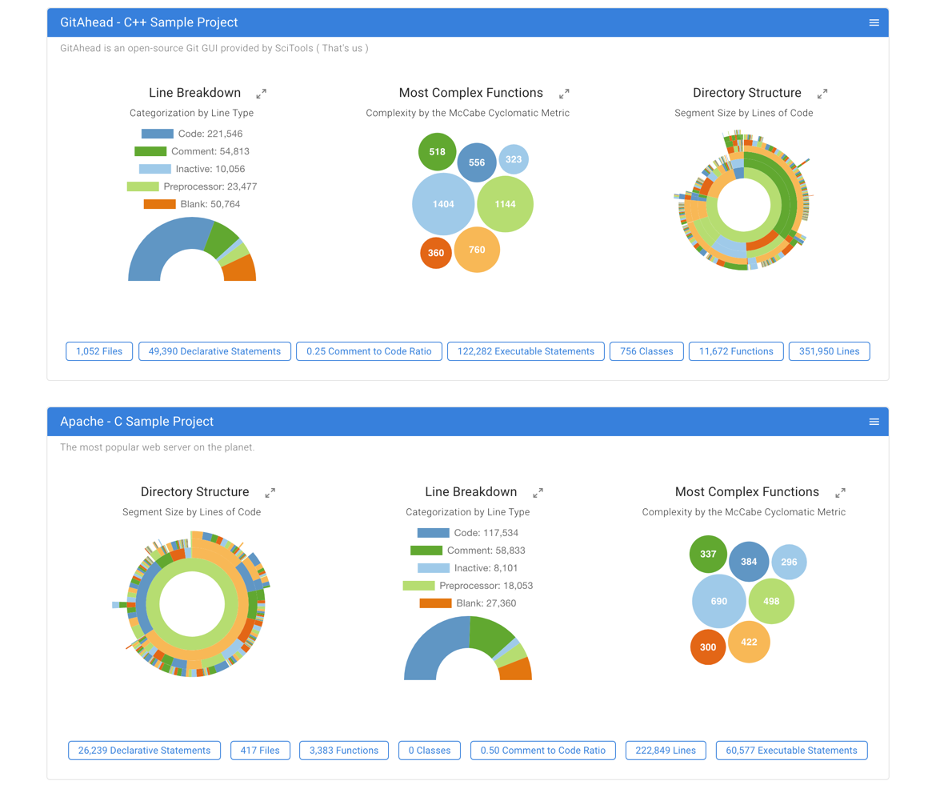
The Line Breakdown chart summarizes several line count metrics. How many line count metrics are there? Here’s a summary of them.
| All Languages | C++ | Html | Javascript | Php |
| CountLineBlank | AltCountLineBlank | CountLineBlank_Html | CountLineBlank_Javascript | CountLineBlank_Php |
| CountLineCode | AltCountLineCode | CountLineCode_Javascript | CountLineCode_Php | |
| CountLineComment | AltCountLineComment | CountLineComment_Html | CountLineComment_Javascript | CountLineComment_Php |
| CountLine | CountLine_Html | CountLine_Javascript | CountLine_Php | |
| CountLineCodeDecl | ||||
| CountLineCodeExe | ||||
| CountLineInactive | ||||
| CountLinePreprocessor |
Other quantity metrics are shown in the artistic bubbles below the charts. For example, you can quickly see that GitAhead has 756 classes whereas Apache (being C) has 0. In Understand, most quantity metrics start with the word “Count.” Other available metrics are language-specific and documented inside Understand. Common ones are CountFile, CountDeclFunction, CountDeclClass, which count files, functions, and classes respectively.
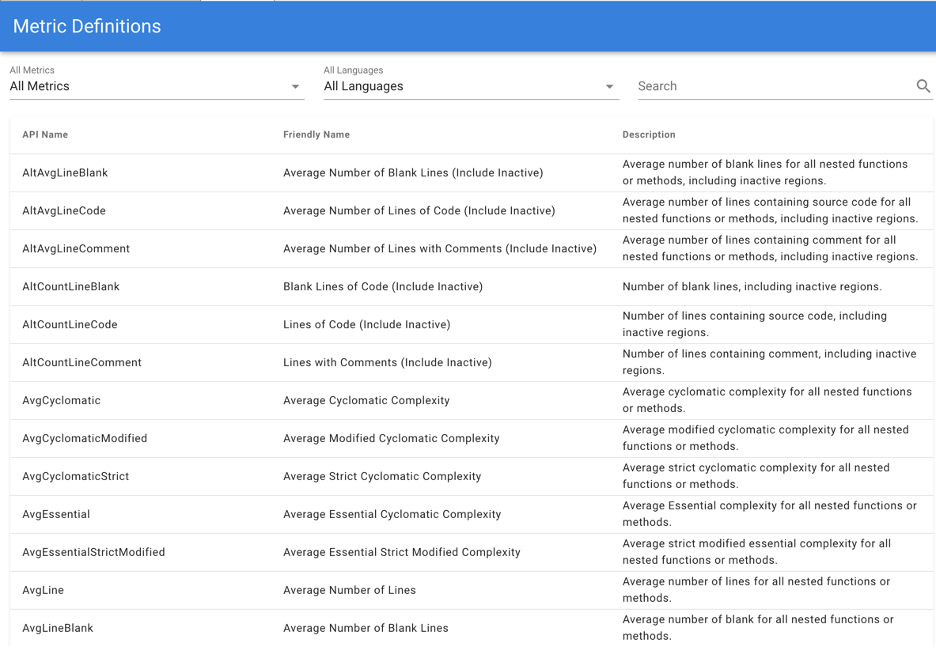
A quantity might not be as useful without context. For example, my count of 50 scorpions inside my house might not matter very much if you don’t know how long I’ve lived in my house. If I tell you I’ve lived in my house for 22 months and so the average number of scorpions is 2.27 per month, the problem is more obvious.
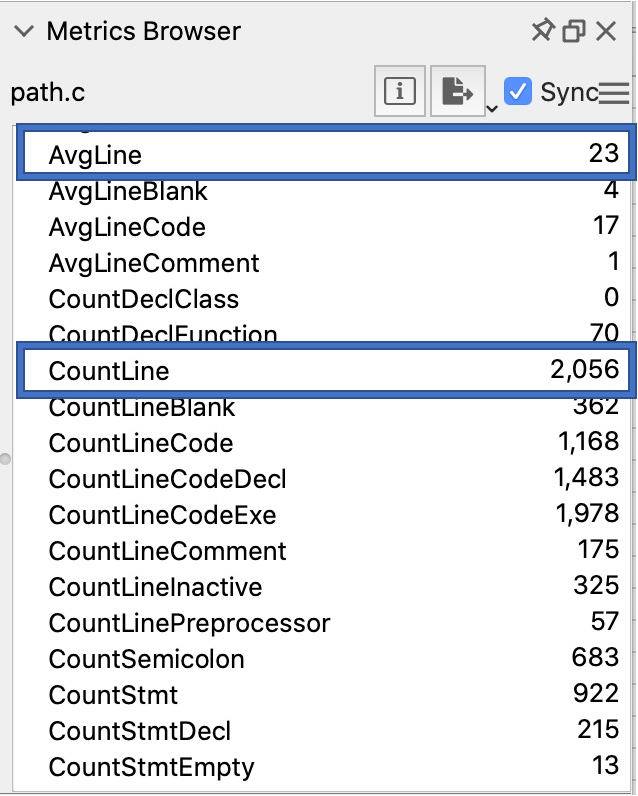
Understand also provides average quantity metrics that can help establish context. For the file “path.c” in the GitAhead sample project, you can see that the total number of lines is 2,056. But you can also see that the on average, each function in the file has about 23 lines. Most averaged count metrics are averaged over functions (sum of the value for each function in scope divided by the number of functions in scope).
Quality
Quality is often subjective. In my opinion, scorpion #29 which was adult-sized and crawling along the ceiling is much worse than scorpion #22 which was small, dead, and on the ground. So, my scorpion quality metrics would be:
- Altitude: ceiling > wall > floor
- Liveliness: moving > stationary healthy > sick > dead
- Size: bigger > smaller
How do you rate code quality? The answer depends on the situation, but Understand provides some common metrics.
For functions, quality metrics typically measure the complexity. The most common one is Cyclomatic which calculates the McCabe cyclomatic complexity. This is the number of decision points plus one. Understand determines decision points by keywords such as “FOR”, “WHILE” and “CASE.” The welcome page uses this metric to list the most complex functions in the project. GitAhead’s most complex function has a value of 1404 and Apache’s most complex function has a value of 690.
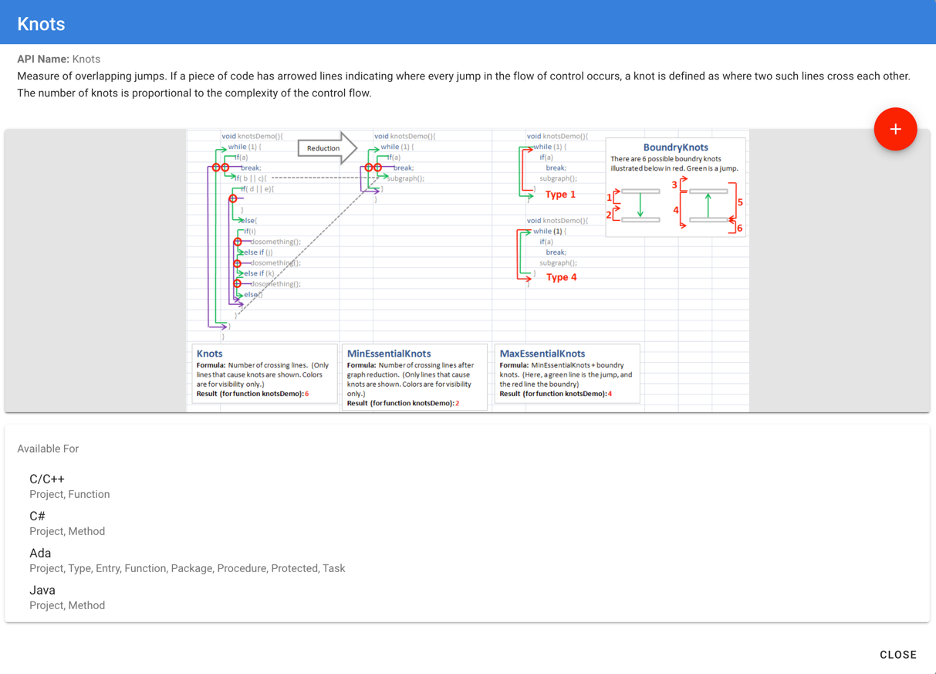
CyclomaticModified and CyclomaticStrict are variants of Cyclomatic with looser and stricter rules respectively. Other complexity metrics include CountPath, CountPathLog, Essential, EssentialStrictModified, Knots, and MaxNesting. The documentation provides examples for each metric. For example, here’s the documentation for Knots:
For classes and files, aggregate information such as the average (AvgCyclomatic), max (MaxCyclomatic) and sum (SumCyclomatic) are used.
Another measure of code quality is the RatioCommentToCode metric. In principle, this provides a measure of code readability. It’s available for entities with CountLineCode and CountLineComment metrics. Note that some lines can contain both code and comments so the sum of CountLineCode and CountLineComment can exceed CountLine.
A final group of quality metrics relates to the connectivity of an entity. For functions, CountInput and CountOutput can give a sense of how influential the function is. CountInput is the number of calls to that function plus the number of parameters plus the number of global variables read. Similarly, CountOutput is the number of calls the function makes plus parameters passed by reference that are set/modified plus the number of global variables that are set or modified. Similar metrics for other entities are CountClassCoupled and CountPackageCoupled. Classes also have an internal connectivity metric: PercentLackOfCohesion (and the variant PercentLackOfCohesionModified).
Applications
So, given all these numbers, how do I solve my pest control problem? Or, more relevant to readers, how can you use Understand’s metrics to solve your problems?
I’ll start with my scorpion problem since I’m a little self-centered. To reduce the number of scorpions in my house, I’d like to find patterns in their appearances. A picture is worth a thousand words, so here’s the picture of my scorpion problem:
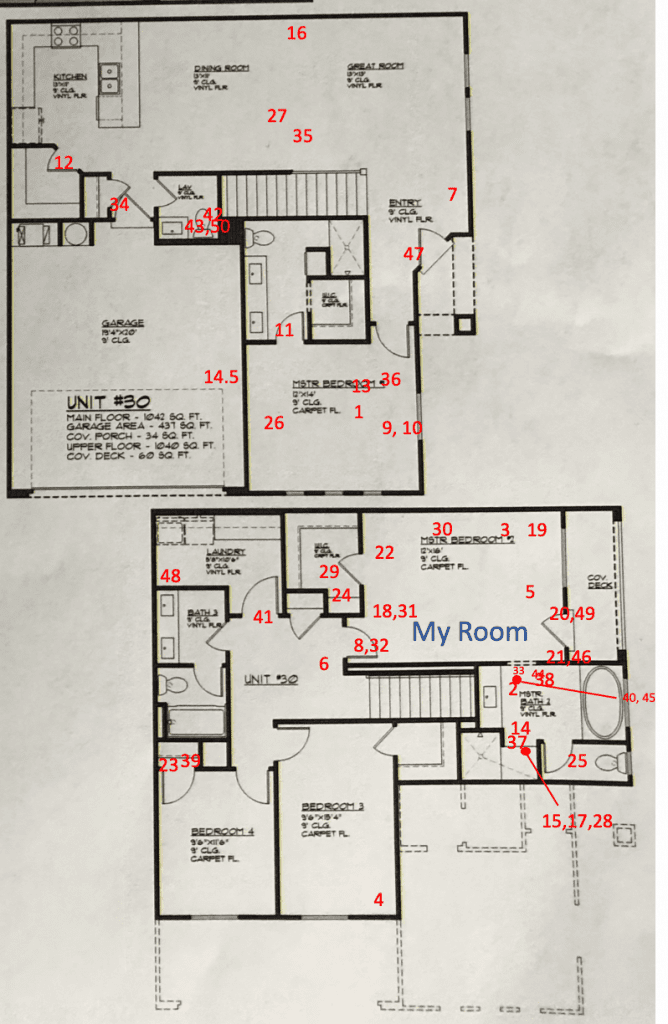
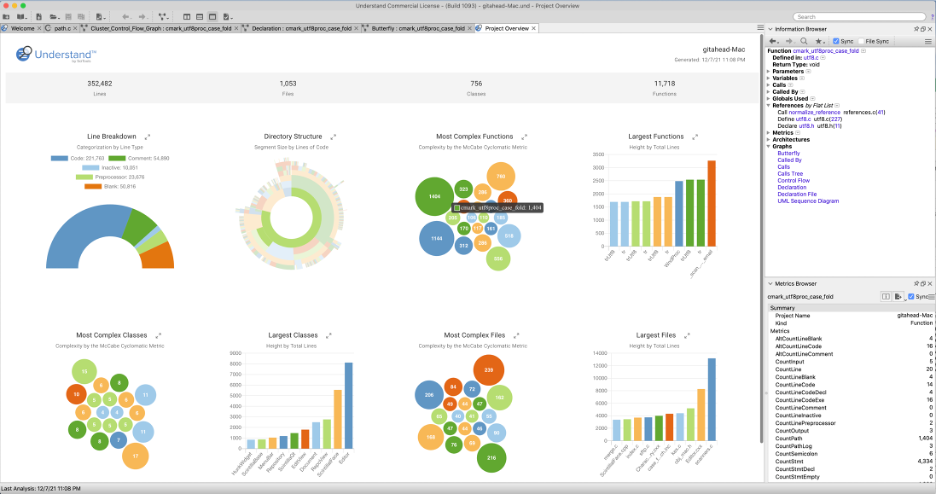
The sad message of this picture is that my room seems especially targeted. Understand also provides pictures that can help you identify targets. For fast overviews, the charts on the Welcome Page shown above can identify areas of interest. The most complex functions chart identifies the top seven functions by the Cyclomatic metric. The Directory Structure sunburst chart gives an overview of the project by the CountLineCode metric.
Once a project is open, you can view Project Overview Charts (Project->Overview). This includes the welcome page charts plus a few additional charts. Clicking these charts syncs the selected entity to other Understand views such as the Information Browser and Metric Browser.
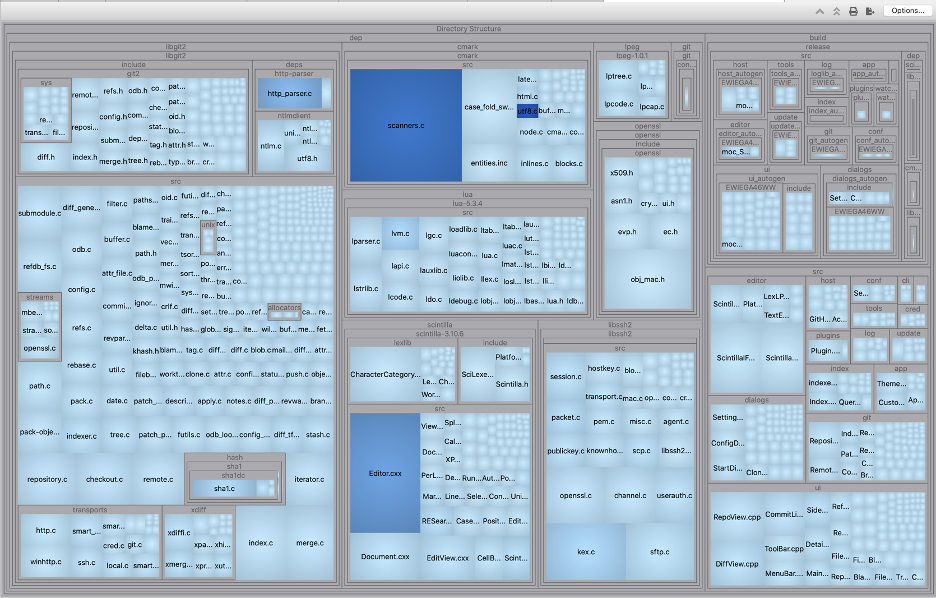
Understand also has a TreeMap where users can select metrics for the size and color. The default TreeMap uses CountLine for the size and MaxCyclomatic for shading. So, for GitAhead, you can quickly see that the file with the most cyclomatic function (darkest blue) is utf8.c in cmark, and that the file is relatively small file by total lines.
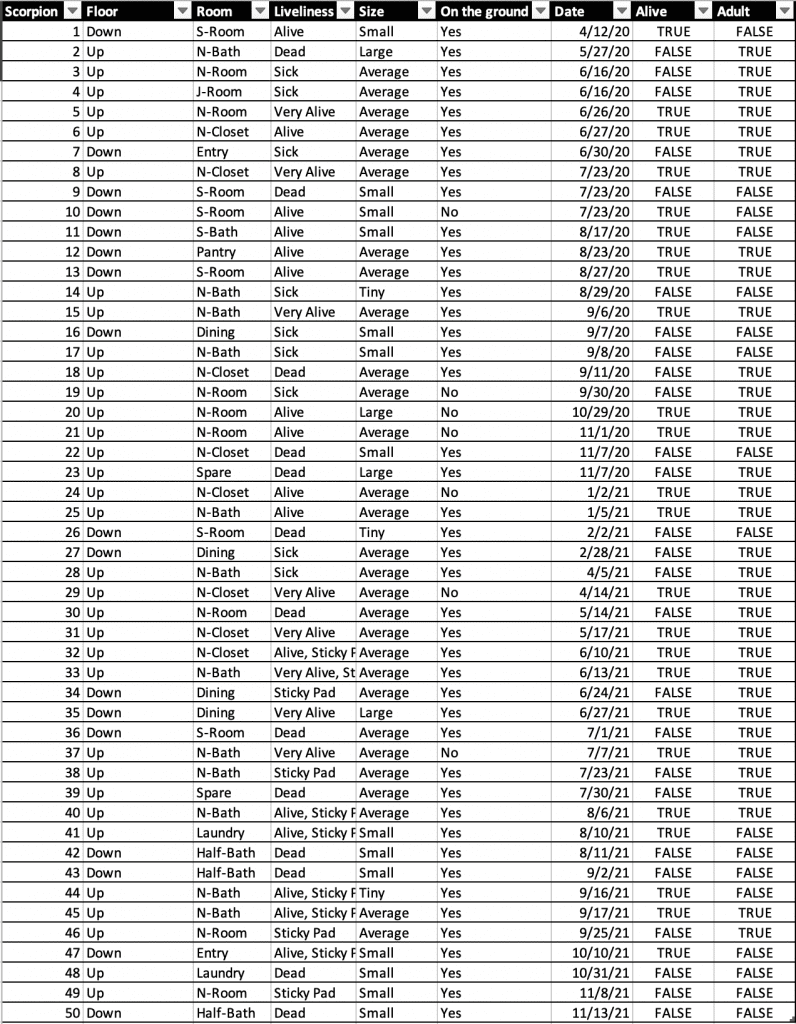
Picture views are helpful for generating overviews, but sometimes what you actually need are the gritty details. For my scorpion problem, the picture only shows the location and lacks information about the time the scorpion was found, the size, the liveliness and so on. So, I also reference a table to see details and do operations like sort and filter. [editor’s note: this is a real table Natasha keeps, we have discussed it at our team lunches several times]
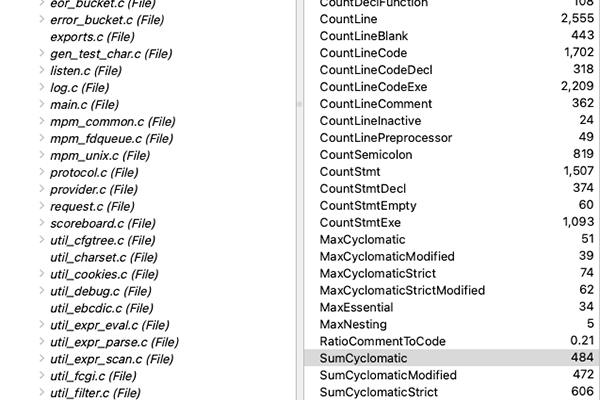
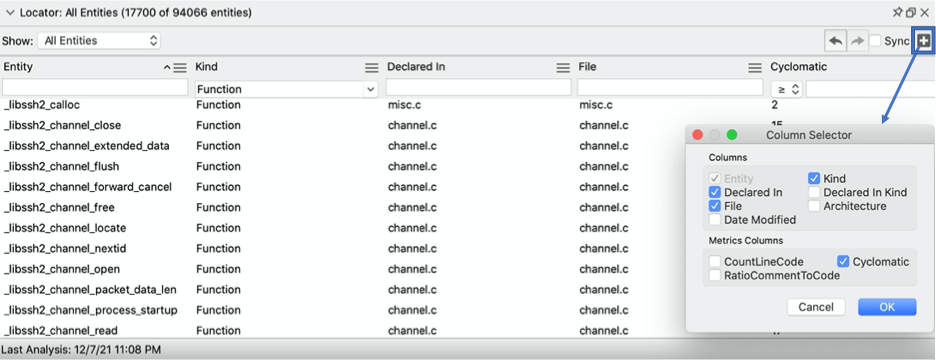
In Understand, the Metrics Browser shows metric details for an entity, but there’s also a table view. The Entity Locator (View->Entity Locator) is a table with sort and filter options. From the plus icon in the corner, you can control the columns shown and toggle selected metrics.
At some point, you may want to get summary metrics for a custom group. For example, I can break up the master bedroom into three areas to try to decide if the scorpions are entering from the attic (N-Closet) the patio (N-Room) or bathroom pipes/vents (N-Bath) where the N stands for Natasha.
| Alive | Dead | Adult | Not Adult | Total | Liveliness Rate | Adult Rate | |
| N-Bath | 7 | 5 | 9 | 3 | 12 | 58% | 75% |
| N-Room | 3 | 5 | 7 | 1 | 8 | 38% | 88% |
| N-Closet | 6 | 2 | 7 | 1 | 8 | 75% | 88% |
By the liveliness percentage, the ones nearer the patio seem to hit the poison more consistently than the ones found nearer the closet, so maybe the closet needs better bug spray.
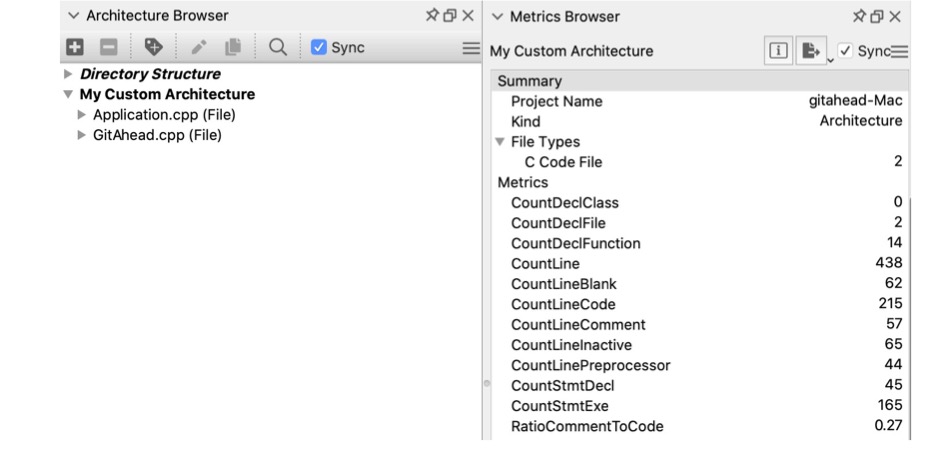
In Understand, Architectures are used to create groups of entities however you want to organize them. For example, you could group them by author, version modified, functionality, or by library. Once you have an architecture, you can view summary metrics for it using the metrics browser:
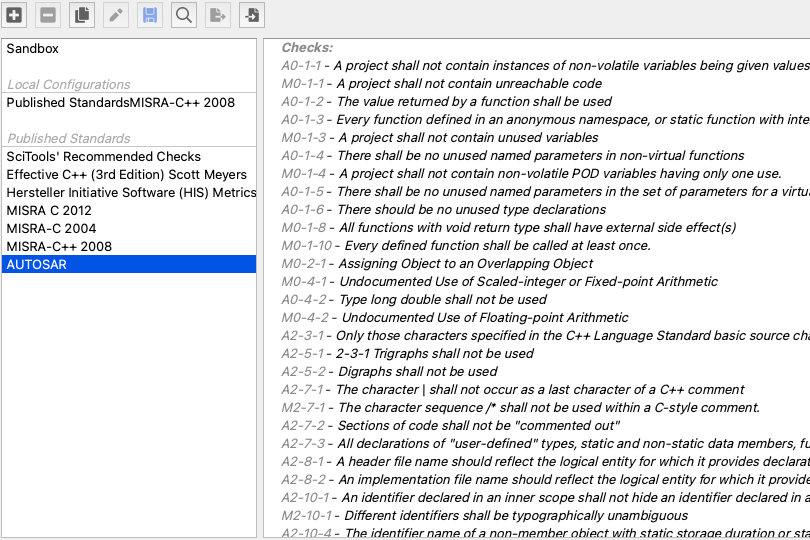
Exploring and identifying problems is helpful, but at some point you want to prevent problems from happening in the first place. Sadly, I have yet to discover a seek-out-and-destroy-scorpions product and am still relying on monthly spraying. But, for programming problems, you’re in luck. Understand provides CodeChecks that can scan your code and identify problems.
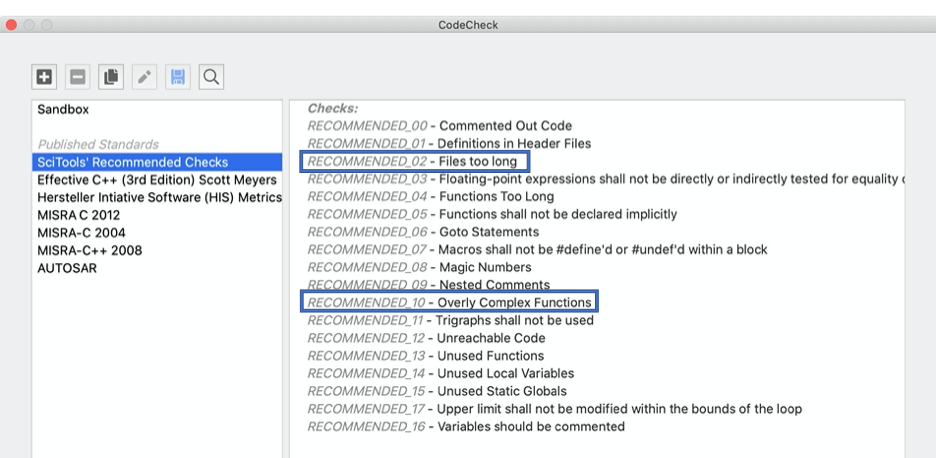
Many metrics have built-in CodeChecks. For instance, Files too long is SciTools’ Recommended #02 and Overly Complex Functions is SciTools’ Recommended #10. If a metric you’re looking at doesn’t already have a CodeCheck, you can write your own checks using Understand’s APIs. You can even send out automated emails whenever a new CodeCheck violation is added. Learn how in this article.
Finally, let’s revisit some of those potential programming problems. How do you convince your boss that you’re being a productive programmer? Try making a custom architecture with the files you write and getting quick numbers on how many lines of code you’ve written. How do you decide how much time a programming task will take you? Check out how much related code there is and how complex it is. How do you prioritize which area of your code needs refactoring the most? CodeCheck can help you quickly identify which areas aren’t meeting your company’s standards.
We’re always interested in how your team is using Understand, what do you use metrics for? Let us know.


