Abstract: A script for virtually executing code.
A debugger inside Understand sure would be nice.
I hope I’m not the only one out there who uses Understand while debugging. Integrating a debugger would save me so much time! I’d always be looking at the same location in both places instead of constantly updating one or the other to match. It would even help the marketing people who would be able to describe Understand as an IDE if we had a debugger.
Sadly, a debugger is not on the list of coming features. The problem is that most of our users are on Windows and Microsoft’s debugger can’t be run without special permission from Microsoft.
A virtual solution
But… what if we use Understand to simulate a debugger. Simulating code execution would aid in understanding the code which is, after all, the main point of Understand. My bosses said, “Great Idea, Natasha, go write it!” In other words, my sincere longing for a real debugger has landed me with the job of prototyping a virtual debugger instead!
Tell us what you think
You can download the virtual-debugger prototype script from the plugin repository here. We’d love feedback so we can decide if it’s worth trying to implement this in the Understand GUI.
Navigation
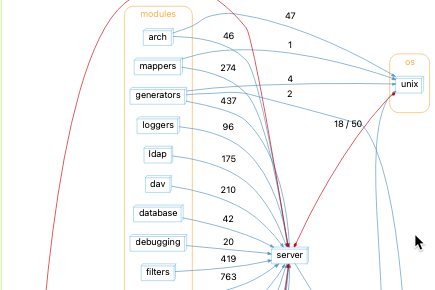
A real debugger uses commands like “step” and “next” to allow users to navigate the code. What can an Understand virtual debugger navigate? Well, Understand has control flow information. You can visualize it with the Control Flow Graph. For the FastGrep sample project, a control flow graph for the function execstrategy looks like this:
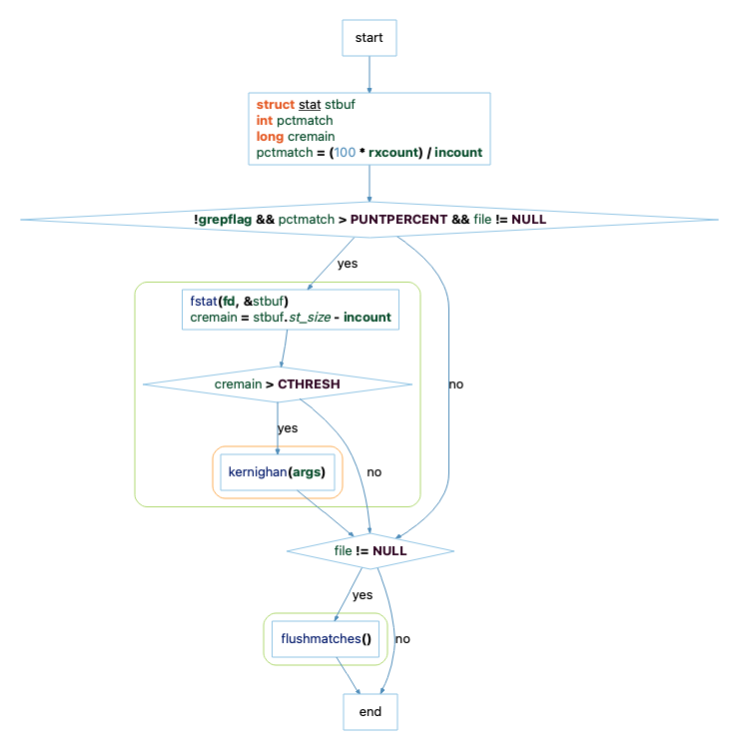
Since we need to navigate this graph structure, it’s worth being aware of a few options. First, the graphical representation of the control flow-graph is combining some nodes because the “Collapse” option is on. This needs to be turned off to see the raw information. Second, because the “Filter” option is on by default, certain nodes like end-if nodes are hidden. To see all the nodes, that option needs to be turned Off. So, the information the script is navigating is actually:
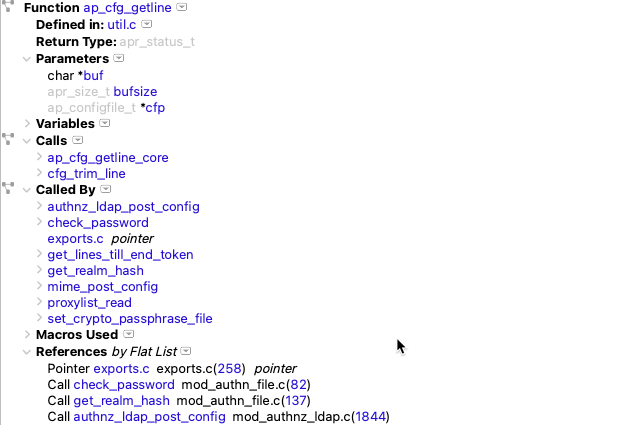
If you were the scriptwriter, the final thing to be aware of is that control flow information doesn’t store any source code. It only stores ranges (start line, start column, end line, and end column). To get the text, we need a lexer.
With all this in place, the script can start with the first control flow graph node, print the source code using the lexer, and use next to go to the next node:
$ ~/sti/bin/macosx/upython ~/projects/scripts/fakedebug.py execstrategy fastgrep-changed.und

Welcome to the fake debugger. Available commands are:
  help        print this message
  next        go to the next control flow node. Optionally give a # argument
              to follow the path # without prompting (ex: "next 0" to follow
              the yes path)
  continue    run until the next choice
  locals      list the local variables, including parameters
  globals     list the global variables that are referenced from the current
              function. Optionally specify "file" to list all globals in the
              current file or globals "all" for all globals in the project.
              (ex "globals file" or "globals all")
  hits        Print the references hit during the current executation for
              the given entity name (ex "hits foobar"). If no entity name
              is given, list all the entities with hits.
  exit/quit   stop debugging

    770  char *file;
    771{
->  772  struct stat stbuf;
    773  int pctmatch;
    774  long cremain;
Enter a command: next
    771{
    772  struct stat stbuf;
->  773  int pctmatch;
    774  long cremain;
    775
The problem comes when we reach a decision node. The fake debugger doesn’t know the current state of any variables so it has no way to pick the right path. The user is going to have to choose.
    775
    776  pctmatch = (100 * rxcount) / incount;
->  777  if (!grepflag && pctmatch > PUNTPERCENT && file != NULL) {
    778    fstat(fd, &stbuf);
    779    cremain = stbuf.st_size - incount;
Enter a command: next
Possible paths from:  !grepflag && pctmatch > PUNTPERCENT && file != NULL
	 0 yes
	 1 no
Enter path number:
Variables
Isn’t there anything Understand knows that can help the user make the decision? Well, yes actually, there is. We know all the times the variables are referenced. But more than that, we know which references have actually been hit in our current execution path.
For the moment, let’s assume the yes path. Then, we can ask for everything that’s known about the pctmatch variable:
Enter path number: 0
    776  pctmatch = (100 * rxcount) / incount;
    777  if (!grepflag && pctmatch > PUNTPERCENT && file != NULL) {
->  778    fstat(fd, &stbuf);
    779    cremain = stbuf.st_size - incount;
    780    if (cremain > CTHRESH)
Enter a command: hits pctmatch
   Define 773 : int pctmatch;
   Set 776 : pctmatch = (100 * rxcount) / incount;
   Use 777 : if (!grepflag && pctmatch > PUNTPERCENT && file != NULL) {
     Choose path yes
A user will still have to decide what particular statements mean. But, with this information, we know the last time pctmatch was set to a value, and based on the use and path chosen, we know that we assumed the constraint that pctmatch is greater than PUNTPERCENT.
Try it out
So, the fake debugger essentially walks a control flow graph and keeps track of all the references that were actually traversed. It has support for picking paths, storing those choices with the associated references, and listing variables. It could be extended to step into functions and maybe even walk backwards instead of forwards.
It’s not my dream of a real debugger, but let us know if you’d find it useful. We’d love your feedback.