Abstract: Three plugins provided by our partner, TechMatrix, that can help you identify and visualize code with low maintainability.
I’ve worked on Understand long enough to know a few areas of the source code I’d rather not touch. The entity locator is one of those areas. I think the design was intended to make it easy to add new locators by separating the logic across an inheritance tree. But the net result is that I’d rather avoid touching that code if at all possible.

What if you haven’t been working on your source code for very long? Or, even if you have, maybe you have to work in a messy area of the code anyway. TechMatrix, our Japanese distributor, provides some custom plugins you can use to help identify and visualize low maintainability code.
Identifying Problematic Functions
What makes a function hard to maintain? The TechMatrix “Low Maintainability Functions Report” plugin uses three metrics to identify those functions.
- Cyclomatic: the McCabe Cyclomatic complexity which is the number of decision points plus 1.
- CountLine: the total number of lines in a function
- MaxNesting: the maximum nesting level of control constructs such as if, while, for, switch, etc.

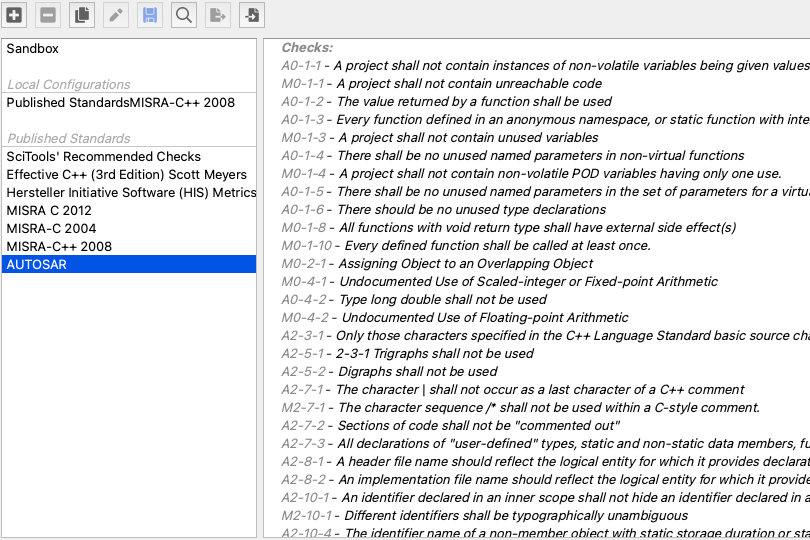
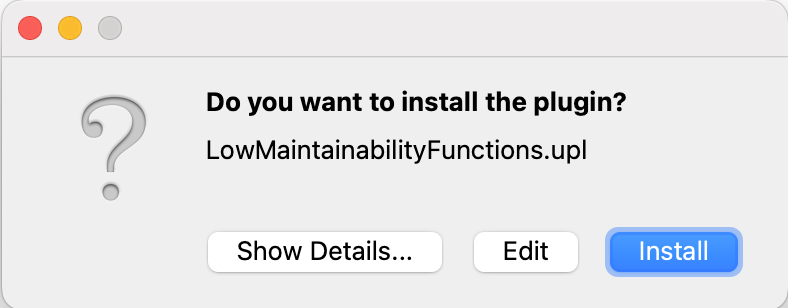
To install this (and any other plugins), simply drag the .upl or .upy file into the Understand Gui. You’ll get a prompt to edit or install the plugin. Selecting install will copy it to the appropriate directory. See this article for more information on where plugins are installed.
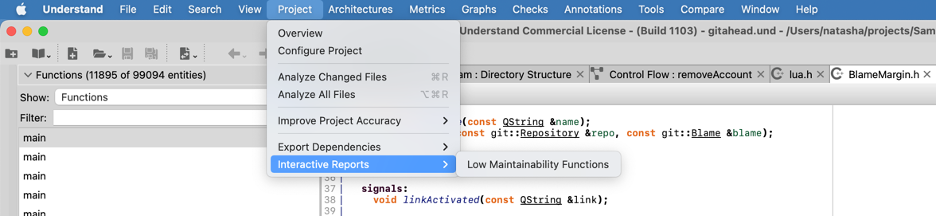
Because this report is global (running for an entire project instead of a specific entity), it’s found in the Project -> Interactive Reports menu.
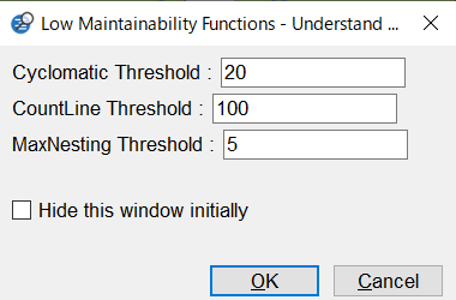
Custom reports like this can have options. In this case, you can specify the threshold value for each of the three metrics:
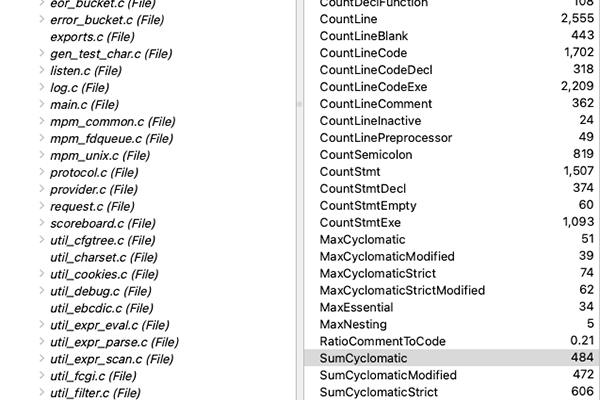
Then, an iReport window will open containing the results:
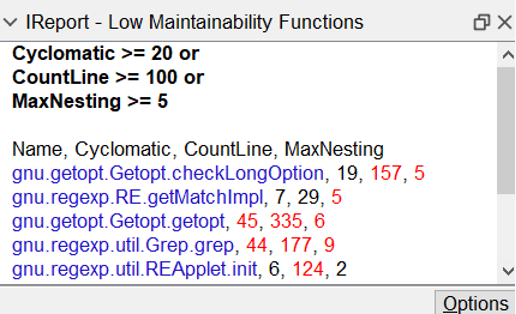
The name of the function (in blue) is a link. Clicking it will sync the entity to other Understand windows such as the information browser. Metrics that didn’t pass the threshold are highlighted in red. The report is comma-separated so it can be opened in Microsoft Excel.
Identifying Problematic Classes
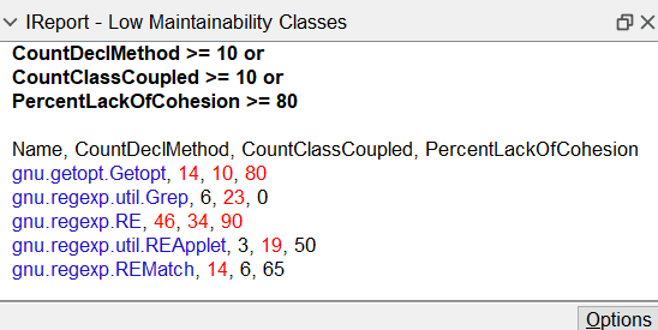
TechMatrix created a similar plugin for low maintainability classes. The three metrics used are:
- CountDeclMethod: the number of local (not inherited) methods
- CountClassCoupled: the number of unique classes that type this class or use data or a member from this class.
- PercentLackOfCohesion: 100% – average cohesion. Cohesion is calculated for each instance variable as the percentage of member functions that use it.
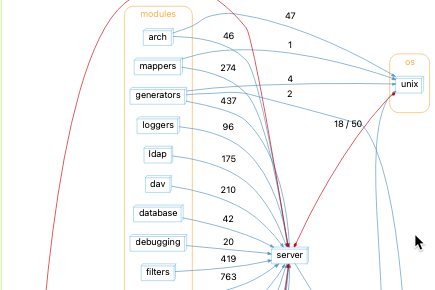
Visualizing Code
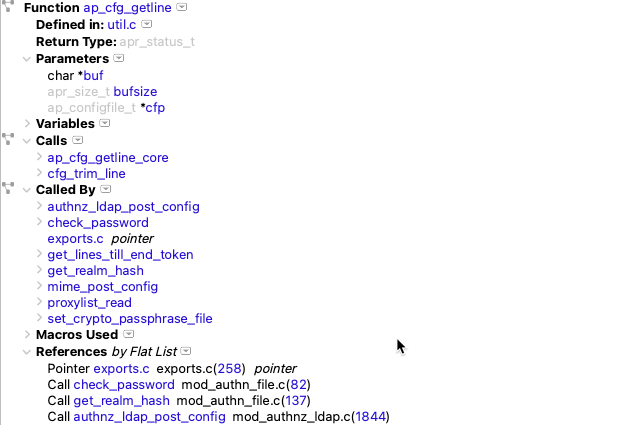
Understand has lots of built-in graphs that can help you identify questionable areas of code. For example, the Control Flow graph is a great place to start. It lets you find areas in a function that can become their own functions.
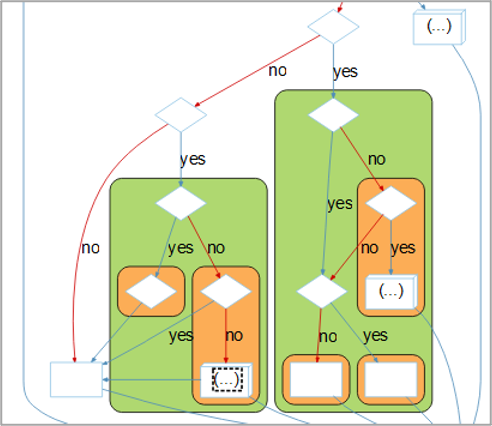
When the built-in graphs don’t meet your need, you can also create your own custom graphs. For classes, TechMatrix provides a custom graph plugin “Calls and Refs Class Internal Graph”. It is designed to showcase the three metrics in the “Low Maintainability Classes” report.
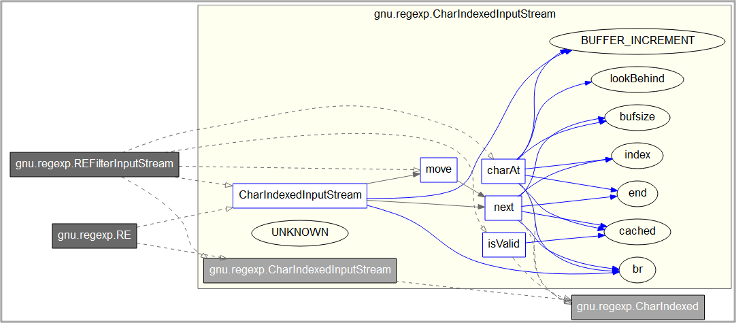
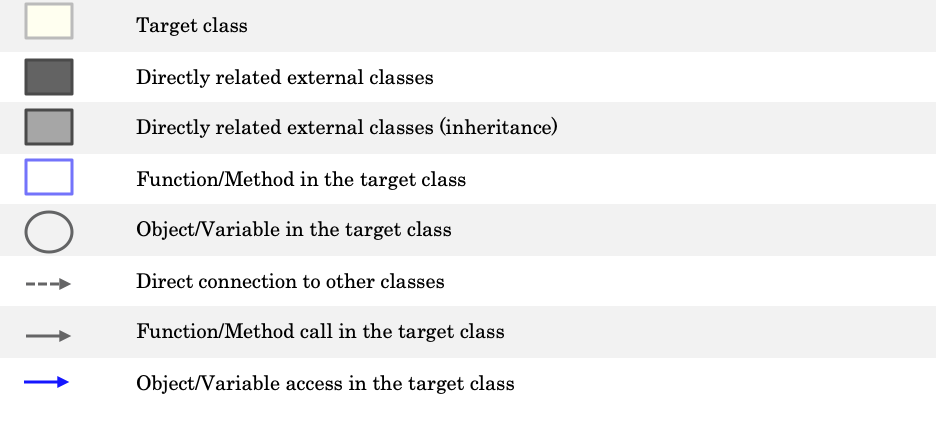
After installing the plugin, access it in a class entity’s context menu under the Graphs submenu. CountDeclClassMethod is the sum of blue outlined member functions. CountClassCoupled is shown by the dark gray external classes connected with dashed gray lines to the initial class. Finally, PercentLackOfCohesion is related to the number of blue edges connecting member functions to member objects.
Just like TechMatrix, you can customize the data from Understand to return exactly the information you need in whatever format you want using our APIs. Dive in!