Abstract: Part 5 of a 5 article series about using Understand to analyze how a CMake-based project has changed over time. This article focuses on calculating statistics by author given Understand databases for many time points.
This is the fifth (and final) article in a series of articles exploring a set of databases for different time points in GitAhead. The first article described how to analyze source code retrieved from Git. The second described automatically creating the set of databases. In the third article, we ran CodeCheck on those databases to generate trendlines and explored graph artifacts. In four we addressed non-linear history by determining the best “parent” database for each commit.
To end things with a bang, let’s hold an author awards ceremony. What can the numbers I’ve collected so far tell me about the various authors who have contributed to GitAhead?
Most Commits Award
One approach to seeing who changed the most is to count the commits by each author. For this, and the rest of the article, I’m only using commits I’ve made databases for. This is the original set of 204 commits (this article) minus the first “initial” commit for a total of 203. Here’s a pie chart with the results:
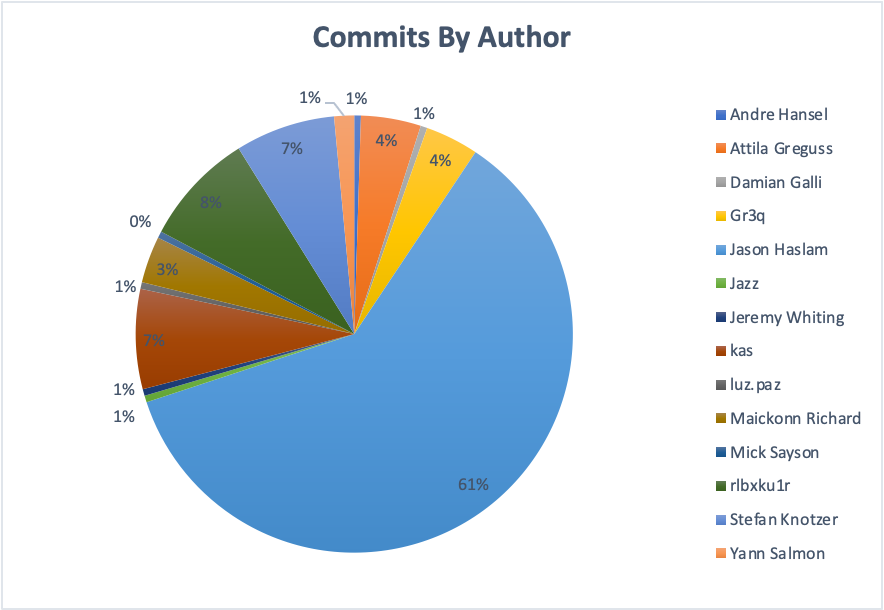
Congratulations Jason Haslam! Not surprisingly, the primary author of GitAhead also has the most commits. Username “rlbxku1r” is a distant second (17 commits with code changes compared to Jason’s 123).
However, this assessment used knowledge directly obtainable from Git. Why create 204 databases and not use them?
Aggregating Database Statistics by Author
This article calculated the change in Code Check Violations for each database compared to the most relevant parent database. These numbers are simple subtractions of the summary counts for each time point. That means they represent net changes, not total changes, and the change can include analysis changes that are unrelated to the changes in the commit.
With these known limitations, let’s try aggregating these statistics by author. Step one is to sort the “Selected Commits Diff” table by author. I’ll store this sorted table in “Author Sorted Diff.” For anyone trying this, double-check that your formulas still reference the right cells after sorting. Mine needed some updating.
I already know the commits by author. The author name is in column B and the commit count (using CountIf) is in column C. Now, I need to find the start row of each author in the sorted table. This is a simple formula (D4=C3+D3) that adds the previous start row to the number of commits added.
Now I can use the handy “OFFSET” function in Excel to generate a range to calculate over. Suppose I want to sum all the changes in total lines, which are stored in column N of the author sorted table. This is the formula:
=SUM(OFFSET('Author Sorted Diff'!$N$2,'Author Statistics'!$D3,0,'Author Statistics'!$C3))
The first argument to OFFSET is the reference range, which is column N in my “Author Sorted Diff” table. The second two arguments describe the start cell. The starting row is stored in my current sheet (Author Statistics) column D. There is no column offset, so that value is 0. The final argument to OFFSET is the number of rows I want to select. That’s the number of commits stored in column C.
Most Changed Lines Award
I can swap out the sum function with the max function, the min function, or, if I want to be really fancy, the sumIf function. I’m going to use the sumIf function to separate lines added from lines removed. The numbers I’m summing over are net line changes so the result will only be an approximation, but that’s much better than nothing. The table looks like this:
| Author | Commits | Start Row | Total Removed | Total Added | Total Change | Min | Max |
| Andre Hansel | 1 | 1 | 0 | 1146 | 1146 | 1146 | 1146 |
| Attila Greguss | 9 | 2 | -7714 | 7458 | -256 | -7543 | 6775 |
| Damian Galli | 1 | 11 | -582 | 0 | -582 | -582 | -582 |
| Gr3q | 8 | 12 | -6455 | 7458 | 1003 | -6455 | 6570 |
| Jason Haslam | 123 | 20 | -66741 | 174854 | 108113 | -7257 | 59631 |
| Jazz | 1 | 143 | -60 | 0 | -60 | -60 | -60 |
| Jeremy Whiting | 1 | 144 | 0 | 714 | 714 | 714 | 714 |
| kas | 15 | 145 | -6433 | 4698 | -1735 | -5706 | 942 |
| luz.paz | 1 | 160 | 0 | 5260 | 5260 | 5260 | 5260 |
| Maickonn Richard | 7 | 161 | -219 | 2301 | 2082 | -219 | 755 |
| Mick Sayson | 1 | 168 | 0 | 323 | 323 | 323 | 323 |
| rlbxku1r | 17 | 169 | -15091 | 2841 | -12250 | -7265 | 1657 |
| Stefan Knotzer | 15 | 186 | -15393 | 39301 | 23908 | -5992 | 27656 |
| Yann Salmon | 3 | 201 | -610 | 73 | -537 | -610 | 68 |
And a graphical view:
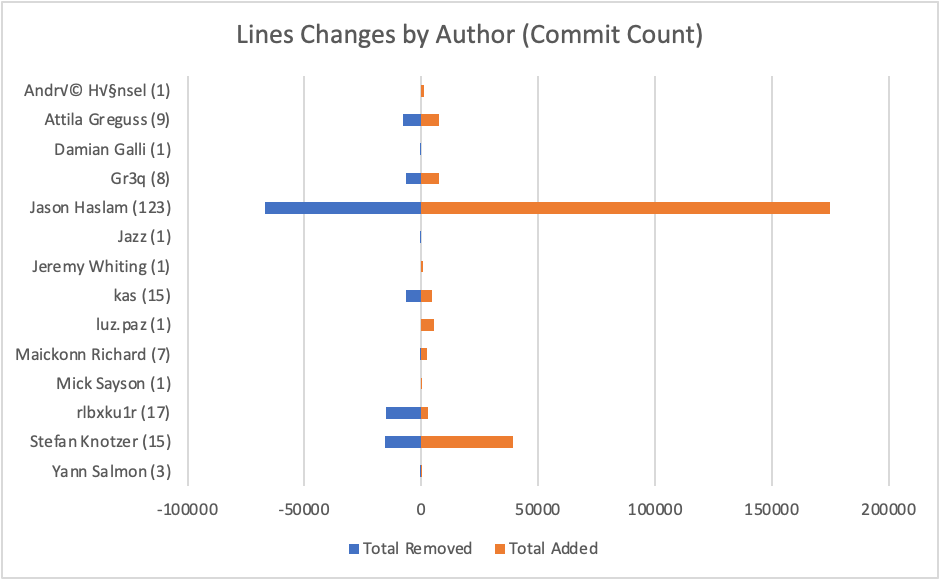
Not surprisingly, Jason’s 123 commits have both added and removed the most lines of code. Interestingly, second place now goes to Stefan Knotzer instead of rlbxku1r.
Most Violations Changed Award
I can do the same thing with CodeCheck violation counts that I did with line numbers. But, if you read on, you (should) agree to not judge these authors harshly. This is an after-the-fact analysis using code checks that were never part of a standard for GitAhead commits. Many of the checks are stylistic in nature like whether definitions are allowed in header files, the maximum lengths of files and functions, or whether variables should be commented. Also, remember from this article that some of these changes are due to analysis changes in Understand rather than code changed in the commit. So, these numbers don’t necesssarily reflect commit quality.
There are 16 CodeChecks out of the 18 SciTool’s recommended checks that had at least one violation for at least one time point. Rather than 16 charts, I went for an aggregate view. Note that each check appears twice in the legend because one is the removed count and the other is the added count. My skills with excel didn’t extend to customizing the legend to skip every other entry.
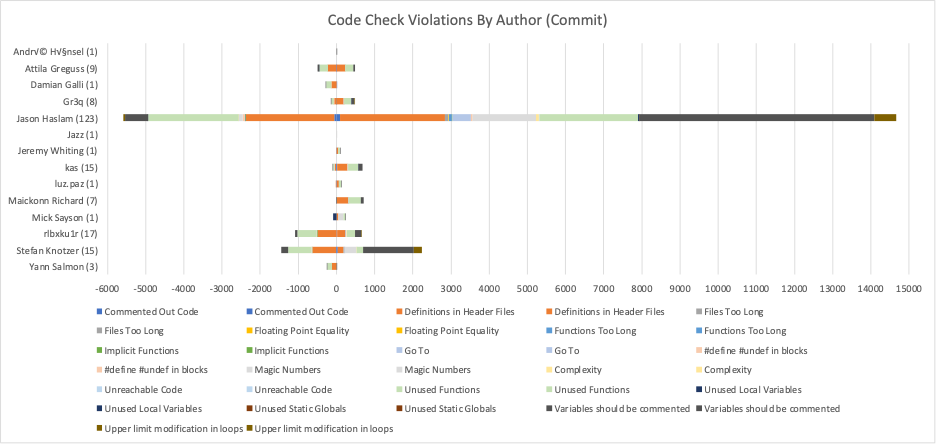
Not surprisingly, the author with the most commits and most line changes also has the most changes in violations. The overall trend seems to match the line changes trend with Stefan Knotzer coming in second on both added and removed violations.
Normalized Violations Award
The changes in violations are limited because the results are not normalized. Authors with more commits or more lines changed are expected to have more changed violations. What is the best way to normalize the data?
I don’t know which way is the “best” way to normalize the data. I’d guess it would use lines of code. However, using lines of code isn’t straightforward with the information I have. Should I use the net change at each commit? A net total? A total of lines removed for violations removed and a total of lines added for violations added?
So, the easiest normalization to calculate is the violation change per commit. Here’s the result:
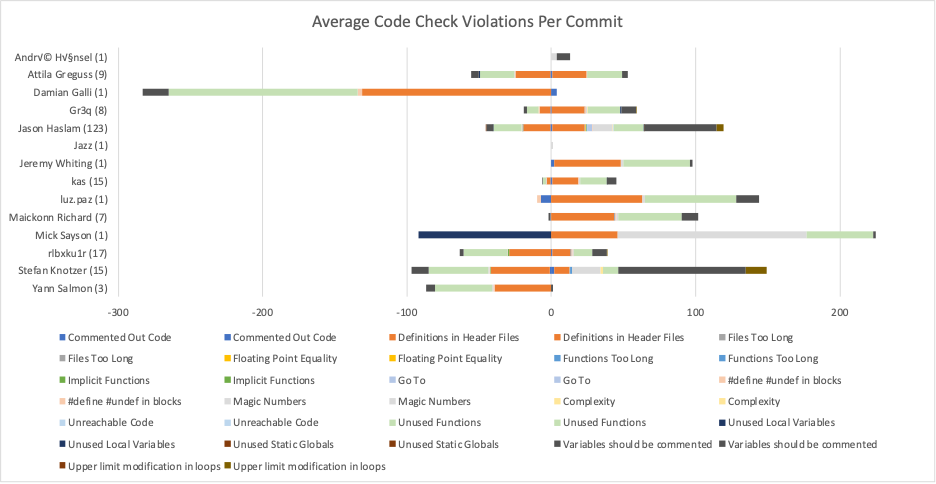
Authors with a single commit become immediate outliers, like Damin Galli with nearly 300 removed violations. Congratulations Damin Galli on the most removed violations per commit! Similarly, Mick Sayson’s single commit had the most added violations at slightly more than 200. However, those are almost certainly due to analysis changes. Mick Sayson’s commit is actually one of my favorites because it removed all the QPainterPath analysis errors by fixing missing includes.
This series of articles was about exploring historic commits, which takes some work. It’s much easier to start capturing data now as part of your DevOps process, then in three months or three years when you want this kind of data, it will be at your fingertips. Here are a few links to help start the integration process: